Next: 4.9 EPIC-pn Out-of-time events Up: 4.8 EPIC spectral analysis Previous: 4.8.6 Response files for extended sources
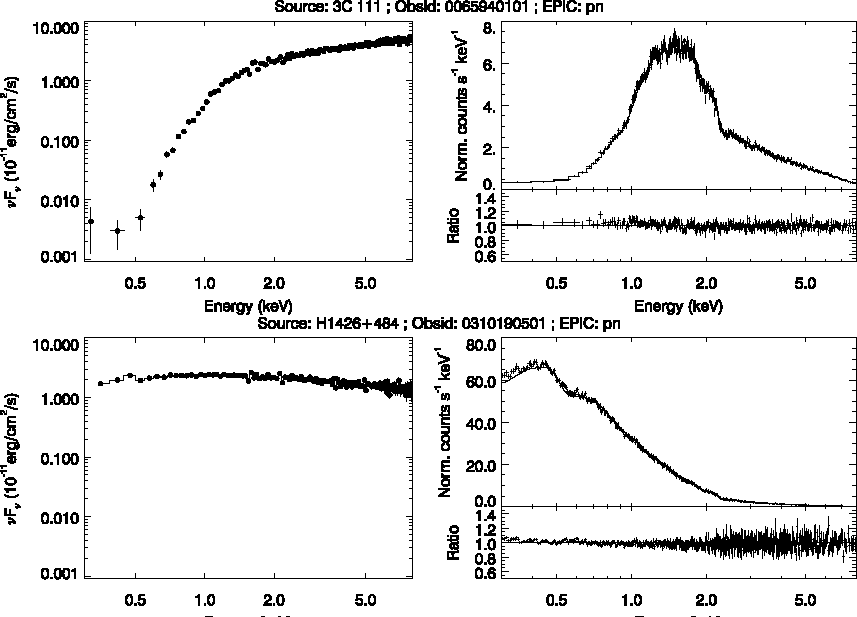
efluxer converts an X-ray EPIC spectrum generated by evselect/xmmselect from the usual counts versus instrument channels space into physical units (i.e. flux density versus energy). The algorithm corrects for the energy redistribution and the effective area of the telescope, for any combination of scientific modes and filters. The output produced as a result of running this task is a FITS file containing the fluxed spectrum, which includes the columns, FLUX, ERROR, ENERGY, ENERGY_BIN. Figure 28 gives two examples to illustrates the results obtained by the use of the efluxer task.
The algorithm used by efluxer inherently degrades the spectral energy resolution with respect to the intrinsic instrumental one. Therefore, users are advised to use the EPIC fluxed spectra to obtain model independent fluxes in broad energy bands or in analysis of continuum shapes or for quick-look analysis and visualisation. Quantitative analysis of narrow-band spectral features or, more generally, any scientific goals requiring the full spectral resolution of the EPIC cameras, should be based on the standard forward-folding approach implemented in, e.g. Xspec[28], SPEX [19] or Sherpa[20], whereby source flux models are convolved with the instrumental response and the convolution compared to the count spectrum.
 |
More information on the task efluxer can be found on the online SAS documentation on individual SAS tasks.
Two examples on how to use efluxer are given in section § 4.12.
European Space Agency - XMM-Newton Science Operations Centre