Next: 5 Analysis of RGS spectrometer data Up: 4.12.3 Source detection example Previous: 4.12.3.1 EPIC source detection performed via single task commands
Assuming that the user either wants to make use of the pipeline generated image products or that he/she has created images in different energy bands, the task edetect_chain can be called to perform all source detection steps described in § 4.12.3.1 via a single command.
The attitude information is assumed to be available from the file attitude.fits (created by the atthkgen task). The example below further assumes that the source detection will be performed on a background cleaned pn thin filter observation (the name of the calibrated and filtered event list being filtered.fits). As noted above, the ECFs for each energy band depend on the EPIC camera, the pattern selection and the filter used during the observation (see XMM-Newton Serendipitous Source Catalogue User Guide [2]).
The complete EPIC source detection chain is started with the following command (note that the ecf values used in the example below are just illustrative):
edetect_chain eventsets=filtered.fits attitudeset=attitude.fits \
              imagesets='image_b1.fits image_b2.fits image_b3.fits \
                         image_b4.fits image_b5.fits' \
              pimin='200 500 2000 4500 7500' pimax='500 2000 4500 7500 12000' \
              ecf='10.596 6.816 2.054 0.995 0.259' \
              eboxl_list=eboxlist_l.fits eboxm_list=eboxlist_m.fits \
              esp_nsplinenodes=16 eml_list=emllist.fits esen_mlmin=10
After completion of the edetect_chain task, the following output
files have been created:
exposure maps (from task eexpmap), detector mask images (from task
emask), background maps (from task esplinemap), eboxdetect
source list (local mode), eboxdetect source list (map mode),
emldetect source list, source maps, if eml_withsourcemap=yes
(from task emldetect) and sensitivity maps (from task esensmap).
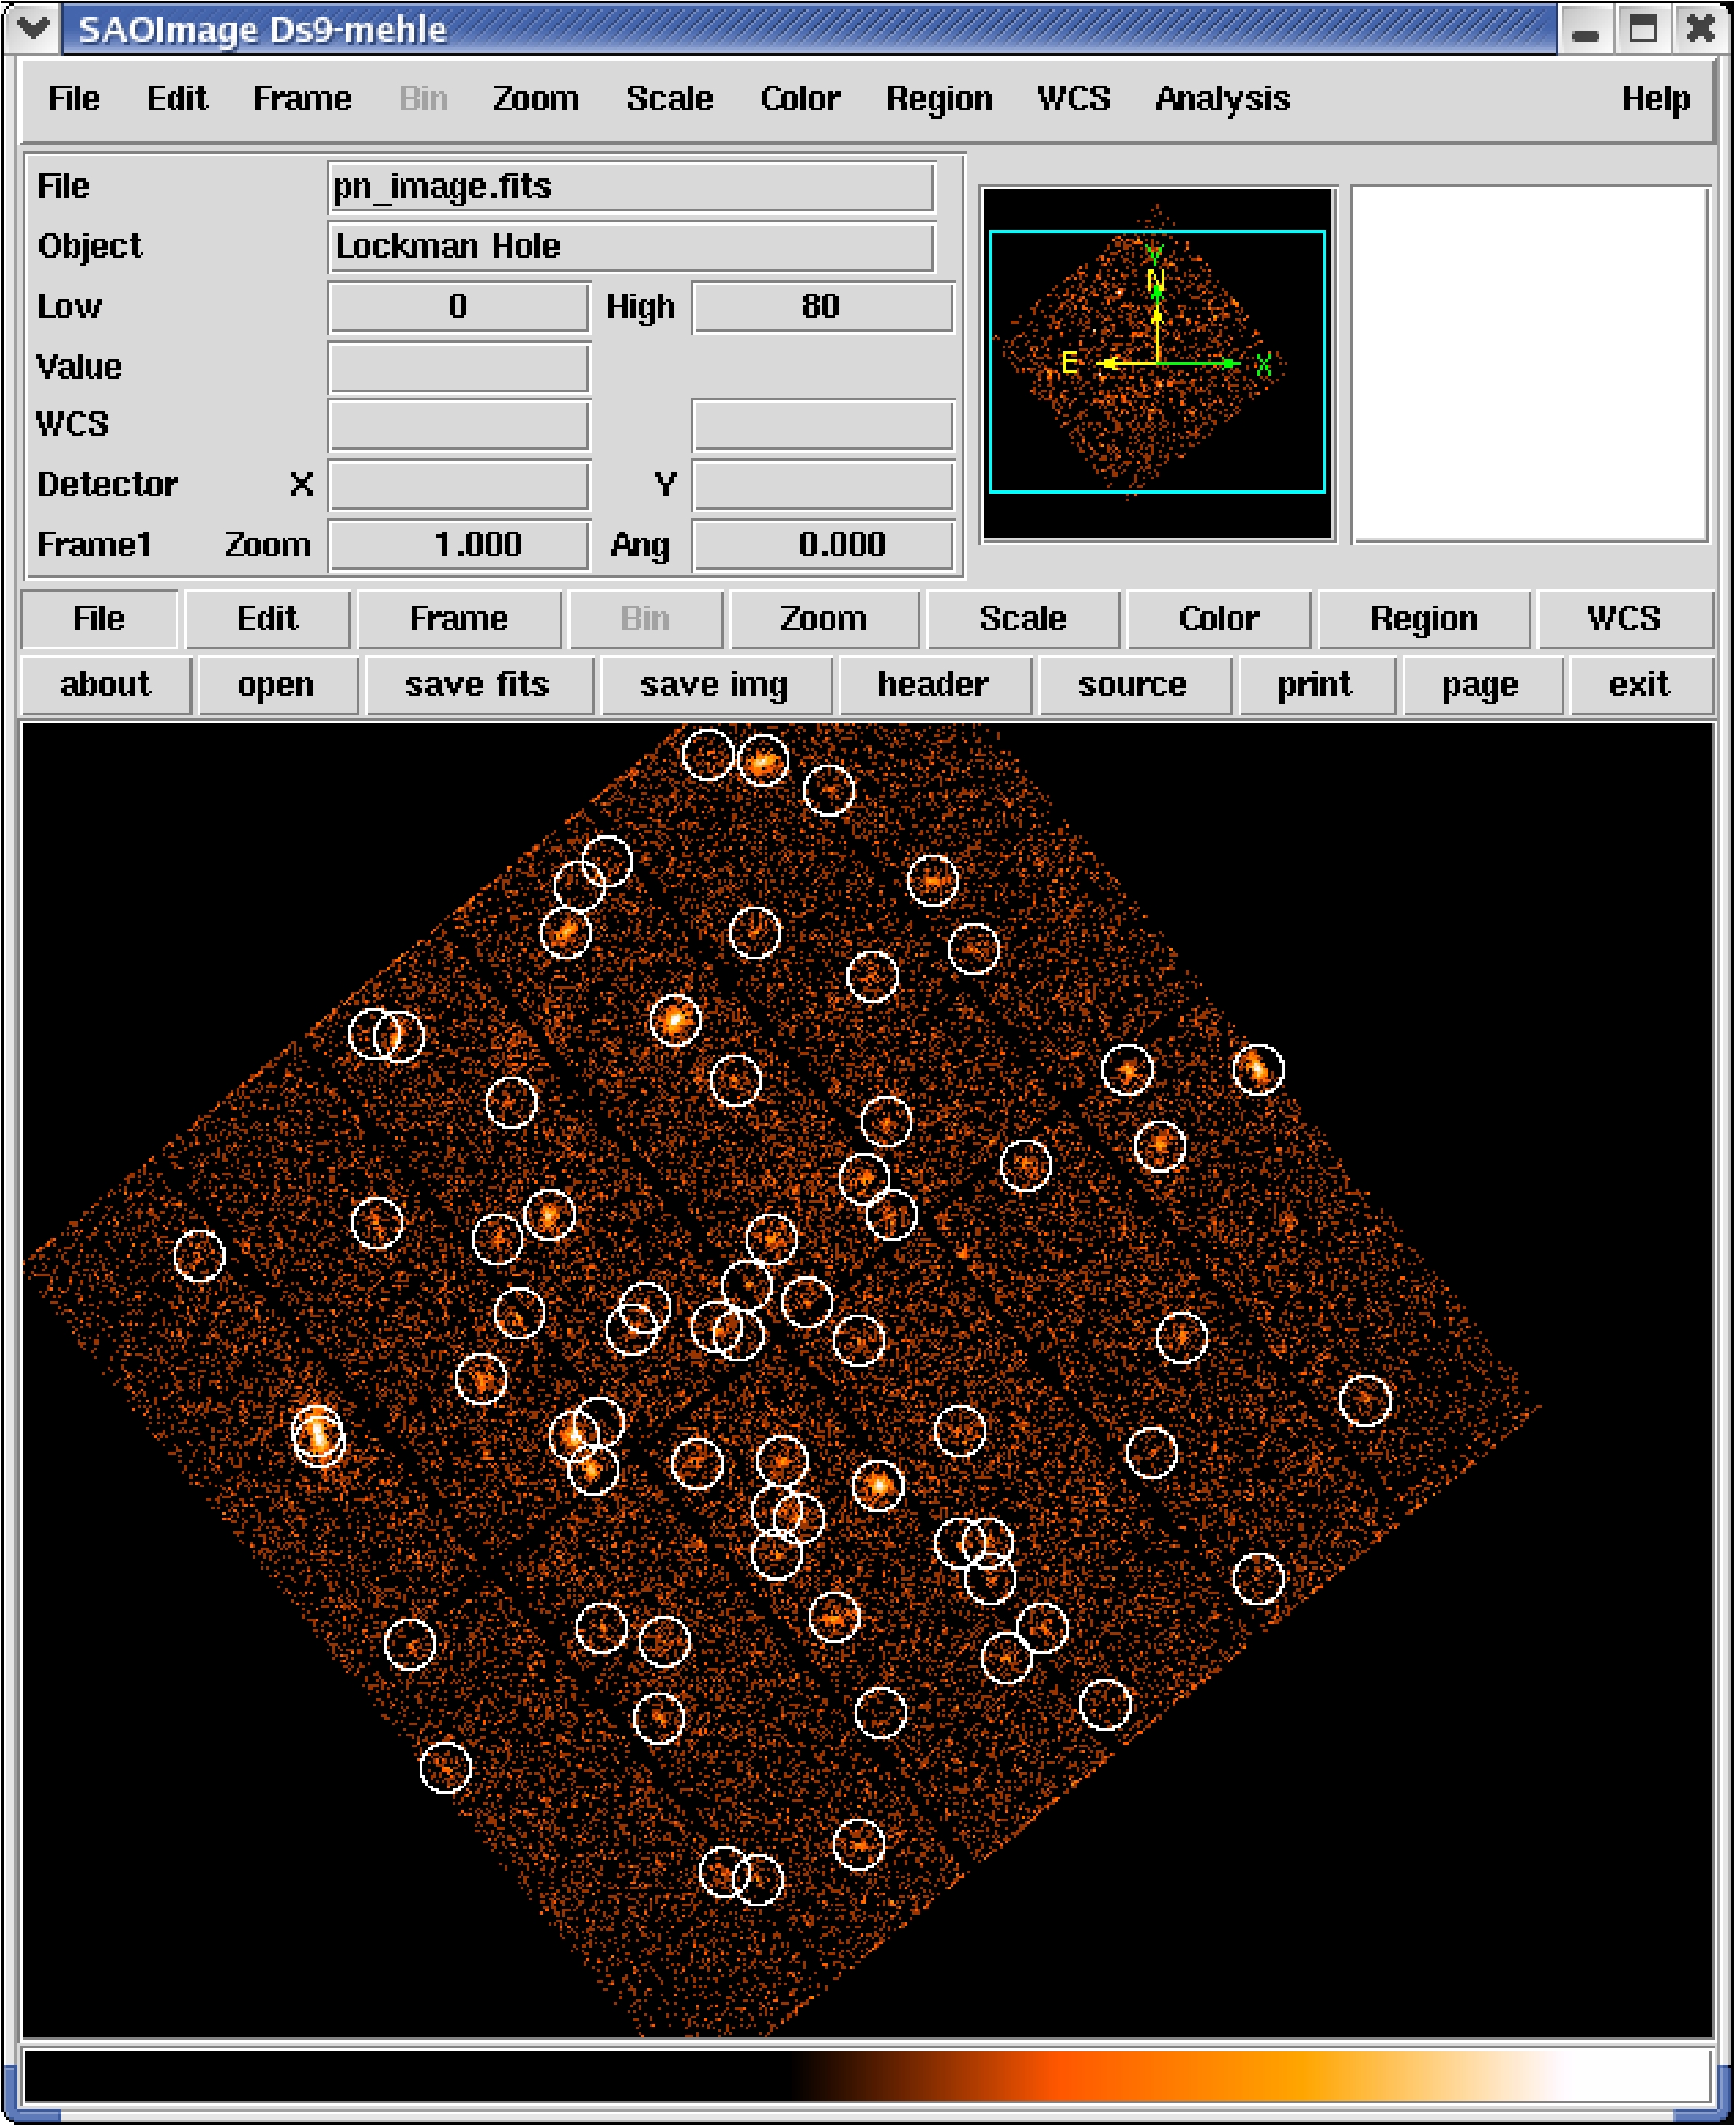
To verify the quality of the performed source detection, the user might want to check generated maps with the image viewer programme ds9. In addition, the task srcdisplay can be used to overlay all the detected source lists onto an image. Circles are used to depict the source positions. The radius of these circles can be set (in degrees) using the sourceradius parameter. An optional ID label can also be displayed, corresponding to the row number of that source in the input source list. This can be enabled through the uselabel parameter. Plotting the ID helps the user to refer back to source properties documented in the source list.
As the plotted circles are in fact ds9-type regions, they can be written out to a file for future use (for example, when running a later ds9 session) by setting withregionfile to true, and specifying the desired file name via the regionfile parameter (set to regionfile.txt by default).
To show e.g. the generated merged source list overlaid onto an EPICimage (called pn_image.fits in the example) the following command can be issued:
srcdisplay boxlistset=emllist.fits imageset=pn_image.fits sourceradius=0.01
Figure 38 shows an example of such a srcdisplay run.
 |
European Space Agency - XMM-Newton Science Operations Centre