XMM-Newton
Users Handbook
3.4.4.6 The RGS Background
The RGS instrumental background has different components, each with
its own characteristics and time dependency. The main components are
listed below. The background characterisation has been performed with
in-flight data by analysing clear sky images (where there is no source
emission) and fitting a model.
- Particle background (minimum ionising particles, protons and
ions). These particles deposit most of their energy outside the 0.35
to 2.5 keV energy band and can thus mostly be rejected by the on-board
software. There is an additional on-board rejection based on the
spatial shape of the events. Except for the period when the spacecraft
is passing through the radiation belts (i.e. for spacecraft elevation
below 46000 km) and occasional solar storms, the in-flight measured
particle background is quite stable. Typically it produces 2.7
 1
events cm
1
events cm s
s , which is a factor 2 higher than expected
pre-launch. This number applies for event rates before any on-board
selection and across the whole field of view. The quoted variation is
larger than the statistical one and is due to variations in solar
background.
, which is a factor 2 higher than expected
pre-launch. This number applies for event rates before any on-board
selection and across the whole field of view. The quoted variation is
larger than the statistical one and is due to variations in solar
background.
- Low energy electrons which enter through the telescope. Electrons
with energies up to 20 keV are rejected by the electron deflector at
the exit plane of the mirrors. Higher energy electrons create
secondary radiation in the spacecraft and detector shielding.
- Fluorescence lines in the detector housing due to interactions
with the electron and other minimum ionising particles. The expected
strong fluence from the detector housing material, Al, is strongly
suppressed by a Au coating. One still expects to see Al K
 and
Au-M emission in the RGS energy band. These lines are indeed
observed at a very low intensity (
and
Au-M emission in the RGS energy band. These lines are indeed
observed at a very low intensity ( 10
10 counts cm s).
- Calibration sources. They can easily be modelled. Nevertheless,
the fraction spilling into the standard event selection regions is
very small, since these are offset in the cross dispersion direction
and additionally placed at locations where their energy signal is
outside the order selection regions.
- Readout noise. Although strictly speaking this is not a background
component, the noise characteristics of each CCD has a tail which
cannot be distinguished from proper X rays. It is roughly constant in
dispersion and cross dispersion directions (with the whole detector,
i.e. before any spectral extraction), and can be modelled by an
exponential pulse height dependency. The typical detector noise count
rate is 10 counts s Å, for the background in
the extracted spectrum.
- Soft protons entering through the mirrors. It has been found to be
consistent with distributions coming from two different components,
one distribution originating from protons being reflected off the
grating array that results in a beam centred on the zero-order
position and the other distribution having a much larger angular
spread consistent with a diffuse non-scattered component. While the
widths of these two distributions appear to be fixed, the overall
count rate and shape are clearly variable with time. Overall particle
count rates variations by a factor 20 have been measured for similar
length observations. The changes in the background shape are related,
according to the models, to changes in the input particle energy
spectrum and on the fraction of protons that are reflected by the
gratings. It is found that this fraction is correlated with the
overall count rate. Quiescent background periods seem to be dominated
by the diffuse component. The count rate in quiet periods is
1-5x10 counts s Å. It should also be noted
that background fluence is generally higher on the CCDs that are
closer to the primary focus (CCDs 8 and 9).
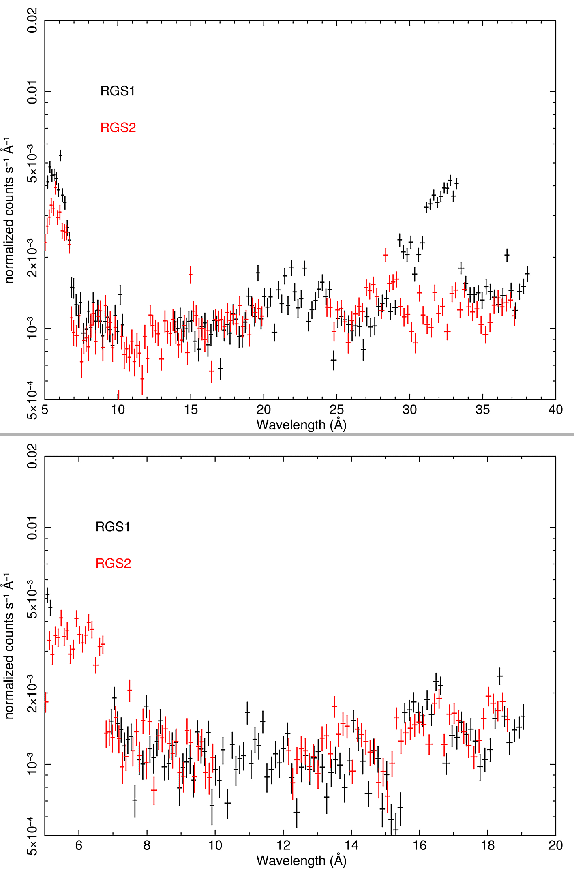
The average background spectrum has been analysed for quiet-time
periods. This has been performed using clear sky images (or “blank”
images) and selecting low background periods (after inspection of the
light curves). The average first and second order RGS1 and RGS2
background spectra are shown in Fig. 87. The total
exposure time is about 170 ks. The spectra have been extracted in a
standard way for the energy, and with the full field-of-view in the
cross-dispersion direction. The background count rate in the quiet
period corresponds to 1-5x10 counts s per RGS resolution
element for a point source.
counts s per RGS resolution
element for a point source.
The fraction of the total exposure time which corresponds to quiet
background periods is unpredictable, as it is basically linked to the
solar activity itself. During the first years of XMM-Newton operations there
have been both “active” and “quiet” background epochs, during which
about 50% and nearly 100% (respectively) of most exposures where taken
with quiet background. A significant fraction of the data collected so
far has much higher background than the one shown in
Fig. 87. This should be taken into account for
exposure time estimates, specially if detection of weak features is the
main objective of the observations.
Figure 87:
The average quiet background spectra from first (top) and
second (bottom) order. RGS1 is shown in black and RGS2 in red. An
enhancement of the count rate below 7 Å in each RGS is due to a
change in the width of the pulse height filter at that
wavelength. There is a bump around 32 Å in the RGS1 spectrum.
The origin has not been fully understood but the most likely
explanation is a somewhat higher dark current for CCD2 in this
RGS. The lower background in the first order spectrum of RGS2 in
this range seems to be related to the use of “single node readout”
mode in this RGS.
 |
Each of the background components described above has a very different
impact on the RGS sensitivity. The first four are either rejected on
board or have low intensity. The major constituents are therefore a tail
on the CCD response due to readout noise, and the soft proton radiation.
European Space Agency - XMM-Newton Science Operations Centre