Next: 3.4.4.2 Resolving Power and Spectral Resolution Up: 3.4.4 In-Flight Performance Previous: 3.4.4 In-Flight Performance
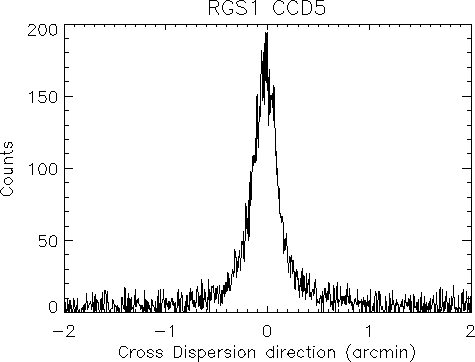
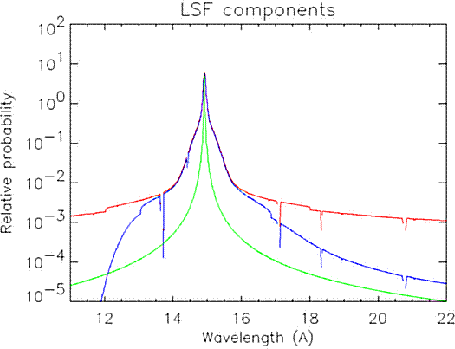
The Line Spread Function (LSF) is a convolution of the response functions of the mirror and the grating, followed by convolution with the detector response. The mirror response is approximated by a Lorentzian profile, which has been calibrated against observations of PKS 0312-770. The grating response depends on the accuracy of the variable line density of the gratings, the figure errors of the gratings, their alignment, and the scattering of X-rays due to surface roughness, this latter seen as the horizontal distribution of events in the bottom panel of Fig. 78. Two scattering components have been identified: a small angle scale Gaussian component, and a large scale Lorentzian component. The wings in the LSF are reduced by applying an energy selection in the CCD response. The effect of this selection is asymmetric, as shown in Fig. 79.
 |
The LSF has been verified in several stellar sources. An example for an
individual line, the first order O VIII Ly (18.97 Å) emission
line in HR 1099, is shown in Fig. 80.
(18.97 Å) emission
line in HR 1099, is shown in Fig. 80.
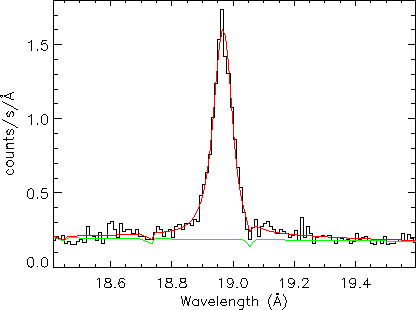 |
The measured data are compared with simulations. There is excellent agreement between the measured performance of the LSF and the predicted one, which is based on pre-flight calibrations. This proves that the predicted resolving power can be achieved.
The profile of this same line in the cross-dispersion direction is presented in Fig. 81.
European Space Agency - XMM-Newton Science Operations Centre