Spectral maps of Jupiter
Minimum credit line: Image courtesy of Graziella Branduardi-Raymont (MSSL, UCL) and ESA. (for details, see Conditions of Use).
Credit: ESA/XMM-Newton, CC BY-SA 3.0 IGO
The image above can be displayed at full size and may be downloaded by clicking the image above.
| About this Image |
|---|
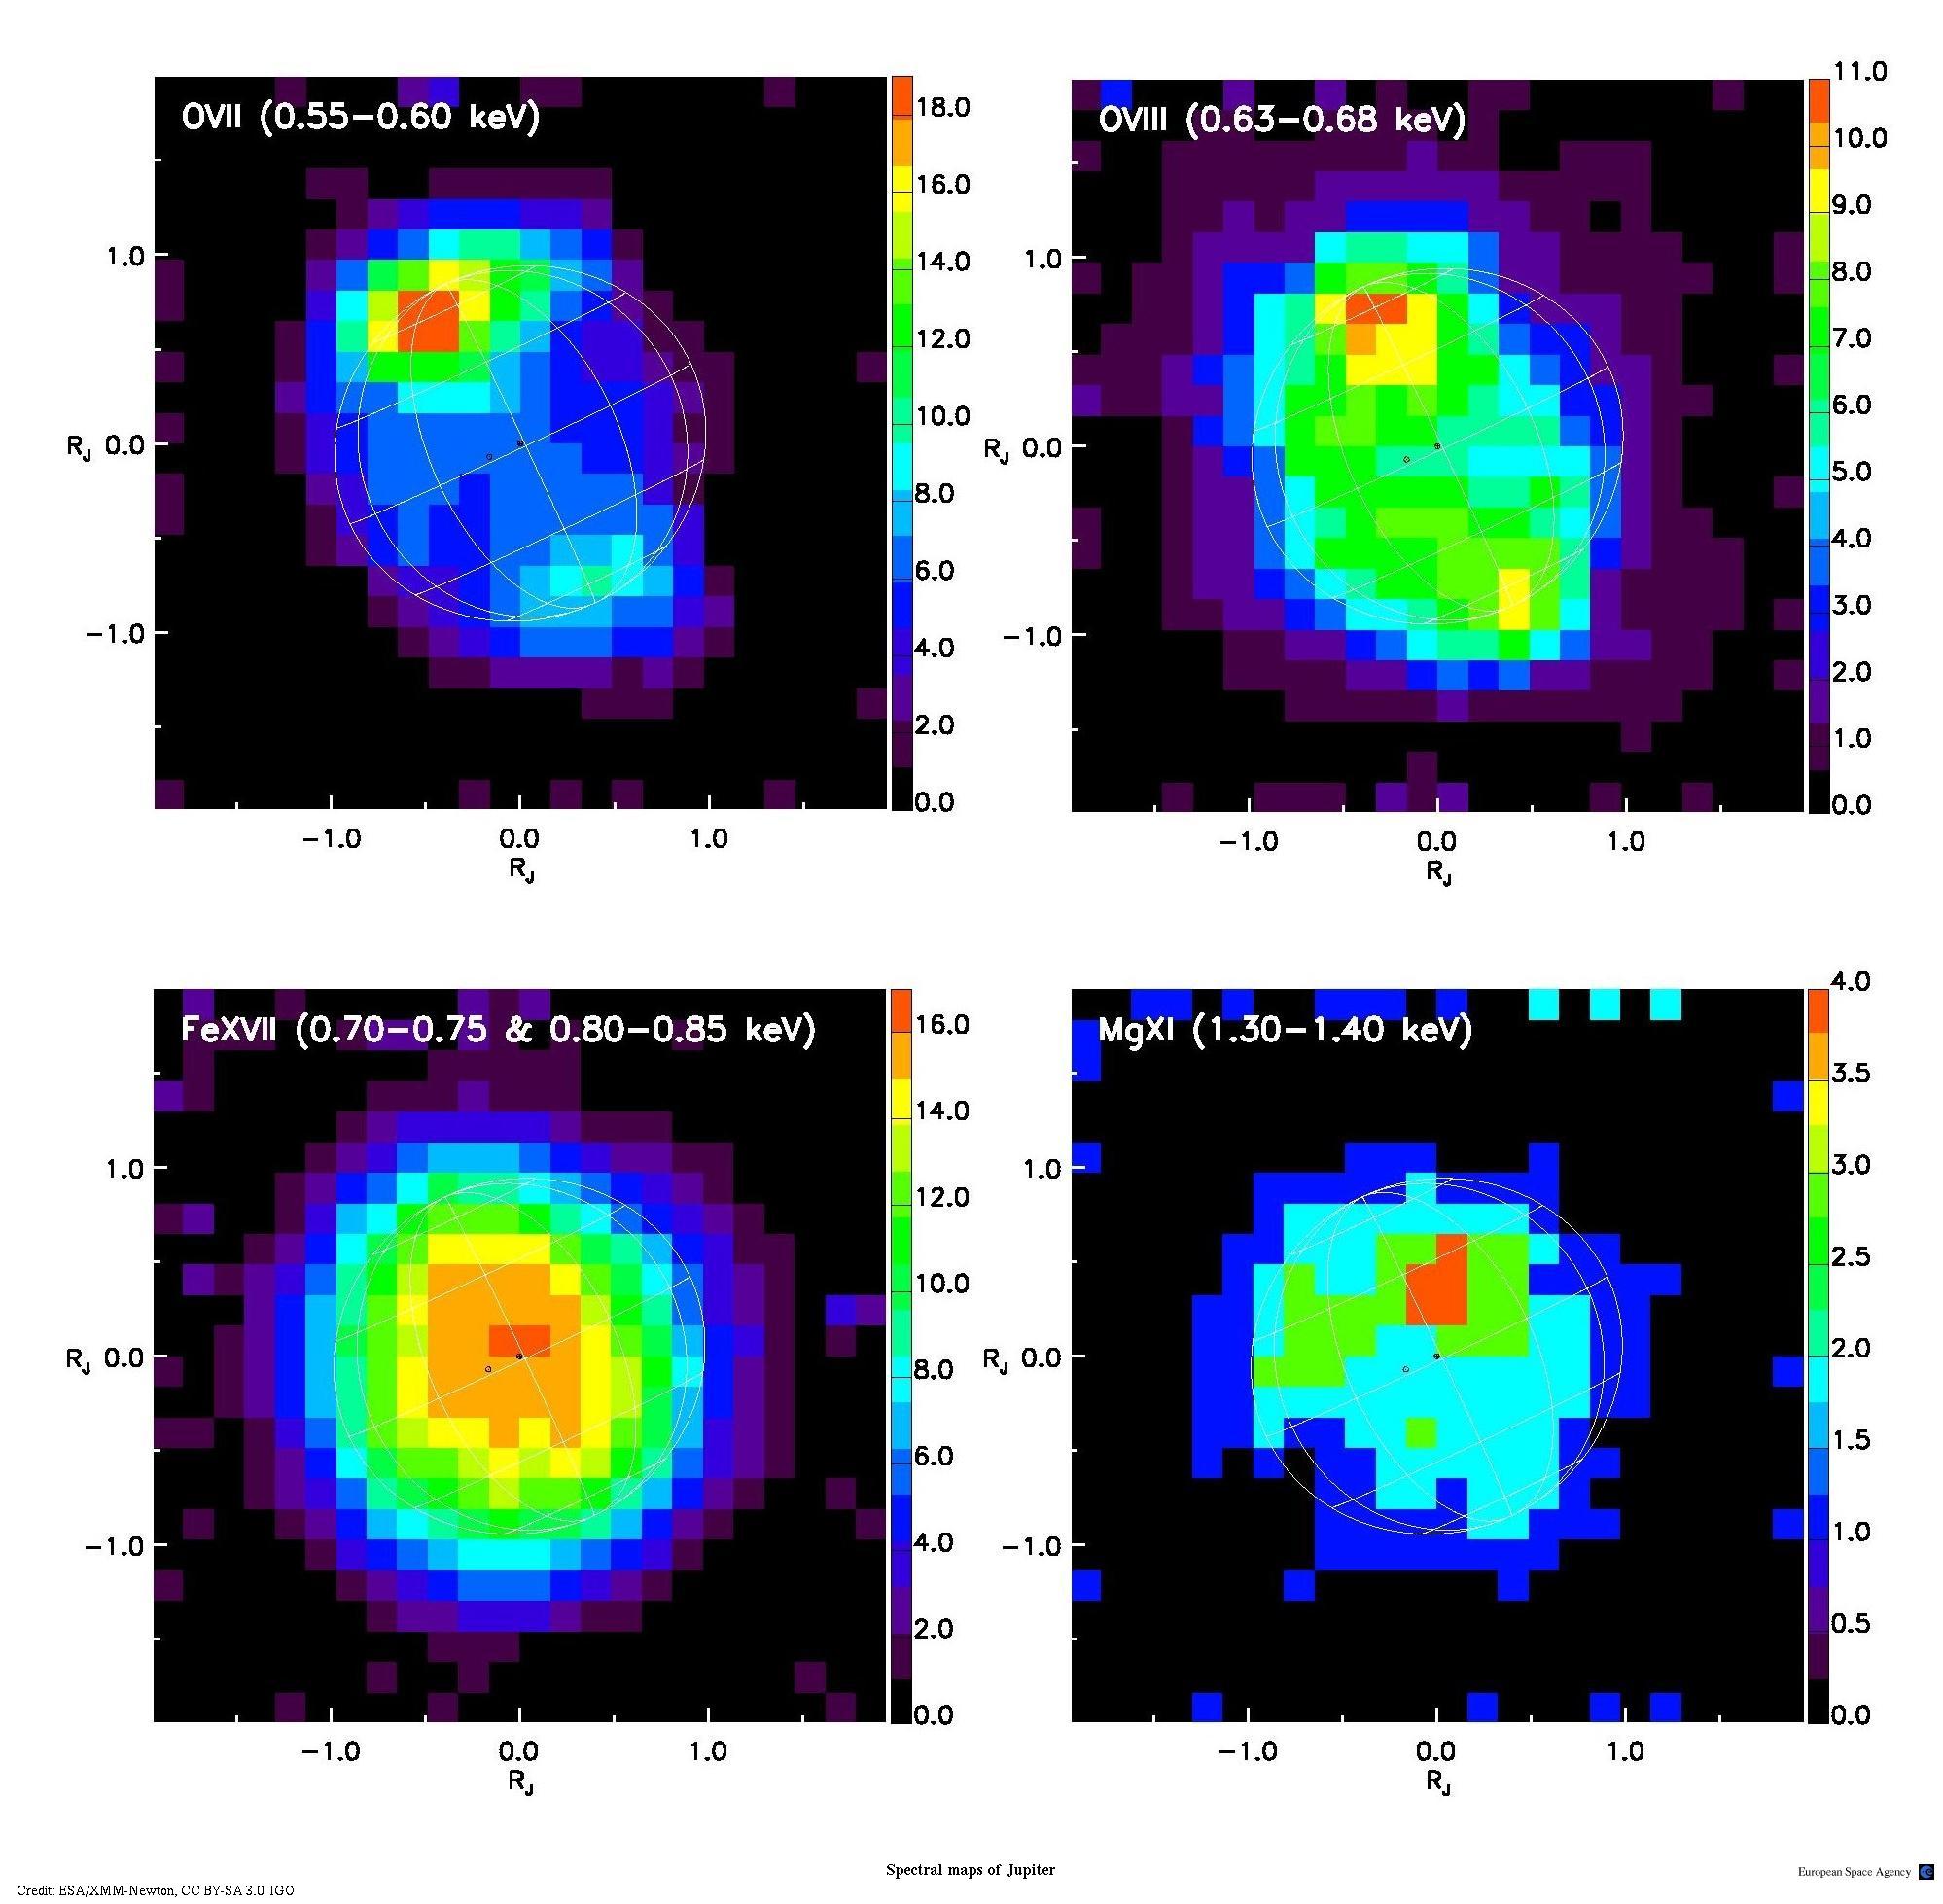
Smoothed XMM-Newton EPIC images of Jupiter in narrow spectral bands. From top left, clockwise: band centred on ionic transitions of OVII (0.55 - 0.60 keV), OVIII (0.63 - 0.68 keV), MgXI (1.30 - 1.40 keV), FeXVII (0.70 - 0.75 and 0.80 - 0.85 keV). The colour scale bar is in units of EPIC counts.
The OVII emission peaks clearly on the North and (more weakly) the
South auroral spots, OVIII extends to lower latitudes, with an
enhancement at the North spot, while MgXI and especially FeXVII
display a more uniform distribution over the planet's disk.
The different spatial distribution of the emissions is thus clue
to their origin: low energy X-rays are produced in the aurorae
and higher energy emission comes from the whole disk of the planet.
Investigator(s): G. Branduardi-Raymont, A. Bhardwaj, R. F. Elsner, G. R. Gladstone, G. Ramsay, P. Rodriguez, R. Soria, J. H. Waite Jr., T. E. Cravens
| For More Information |
|---|
- Read the Journal article
- Detailed description of this image
- For unfamiliar terms, visit the XMM-Newton Astronomical Glossary
| Alternate Resolutions | (Help) |
|---|
This image is available in the following downloadable versions: Higher resolution versions of this image may be available, please contact the XMM-Newton HelpDesk.
Search the Image Gallery
To search the Image Gallery for a particular object, fill in the object name in the box below and click the Submit button.To search the Image Gallery for other images, fill in any of the fields below and click the Submit button.
For more search options, please use our Advanced Search form.