Next: 4.3.2.1.2 Flagging soft flare events in EPIC-pn timing mode data Up: 4.3.2.1 Improving the quality of EPIC-pn data: epreject Previous: 4.3.2.1 Improving the quality of EPIC-pn data: epreject
It comprises the two following separated subtasks: 1
There are two methods for retrieving the affected pixels and the corresponding energy shifts: (i) directly from the transmitted offset map or (ii) from the spatial and spectral distribution of the transmitted events. The first method is more straightforward and reliable than the second one, but it requires that the offset map is available, which is not always the case.
(i) The offset map, if available, contains for each pixel the adu (analogue digital unit, where for EPIC-pn 1 adu=5 eV) value which was subtracted from all events in the particular pixel before transmitting this information to ground. As it contains both correct and incorrect offsets, the main goal is to distinguish between both cases. This distinction is possible under the (realistic) assumption that the generic offsets of all pixels (not affected by electronic effects during readout) are very similar and that the areas where incorrect offsets were computed occur in isolated patches. In this case, all the information necessary for correcting accidental shifts in the energy scale can be extracted from the offset map in a straightforward way [17]. This is the default mode of epreject, if the offset map is available.
(ii) If the offset map is not available, then the information about the affected pixels and the corresponding energy shifts can be (approximately) reconstructed from the event file in the following way: an image is accumulated from all events which have a raw amplitude of 20 adu (the lowest amplitude transmitted). This image is then analysed for the occurrence of bright patches, and from the brightness of each patch the corresponding energy shift is reconstructed, by the method described in [17]. This energy shift is then applied to all events in the corresponding patch.
This method relies on the quality of the 20 adu image, which depends on the exposure time of the observation. In particular for short exposures, the presence of Poissonian noise in the 20 adu images limits the sensitivity for spotting the bright patches and deriving the appropriate energy correction. A parameter is supplied to the user for adjusting this sensitivity: the parameter sigma specifies the minimum significance which a block of four consecutive pixels along readout direction must have in order to trigger the energy correction for events in this block.
Tests indicate that sigma=4.0 (the default) is a good choice for
short (![]() ks) exposures; for longer exposures this parameter can
be increased (to
ks) exposures; for longer exposures this parameter can
be increased (to ![]() - 6 for more than 20 ks). It is recommended to
control the results by accumulating an image below 20 adu after this task,
as this image shows then all the pixels where an offset shift was applied.
In most cases, the default setting should provide a reasonable result.
- 6 for more than 20 ks). It is recommended to
control the results by accumulating an image below 20 adu after this task,
as this image shows then all the pixels where an offset shift was applied.
In most cases, the default setting should provide a reasonable result.
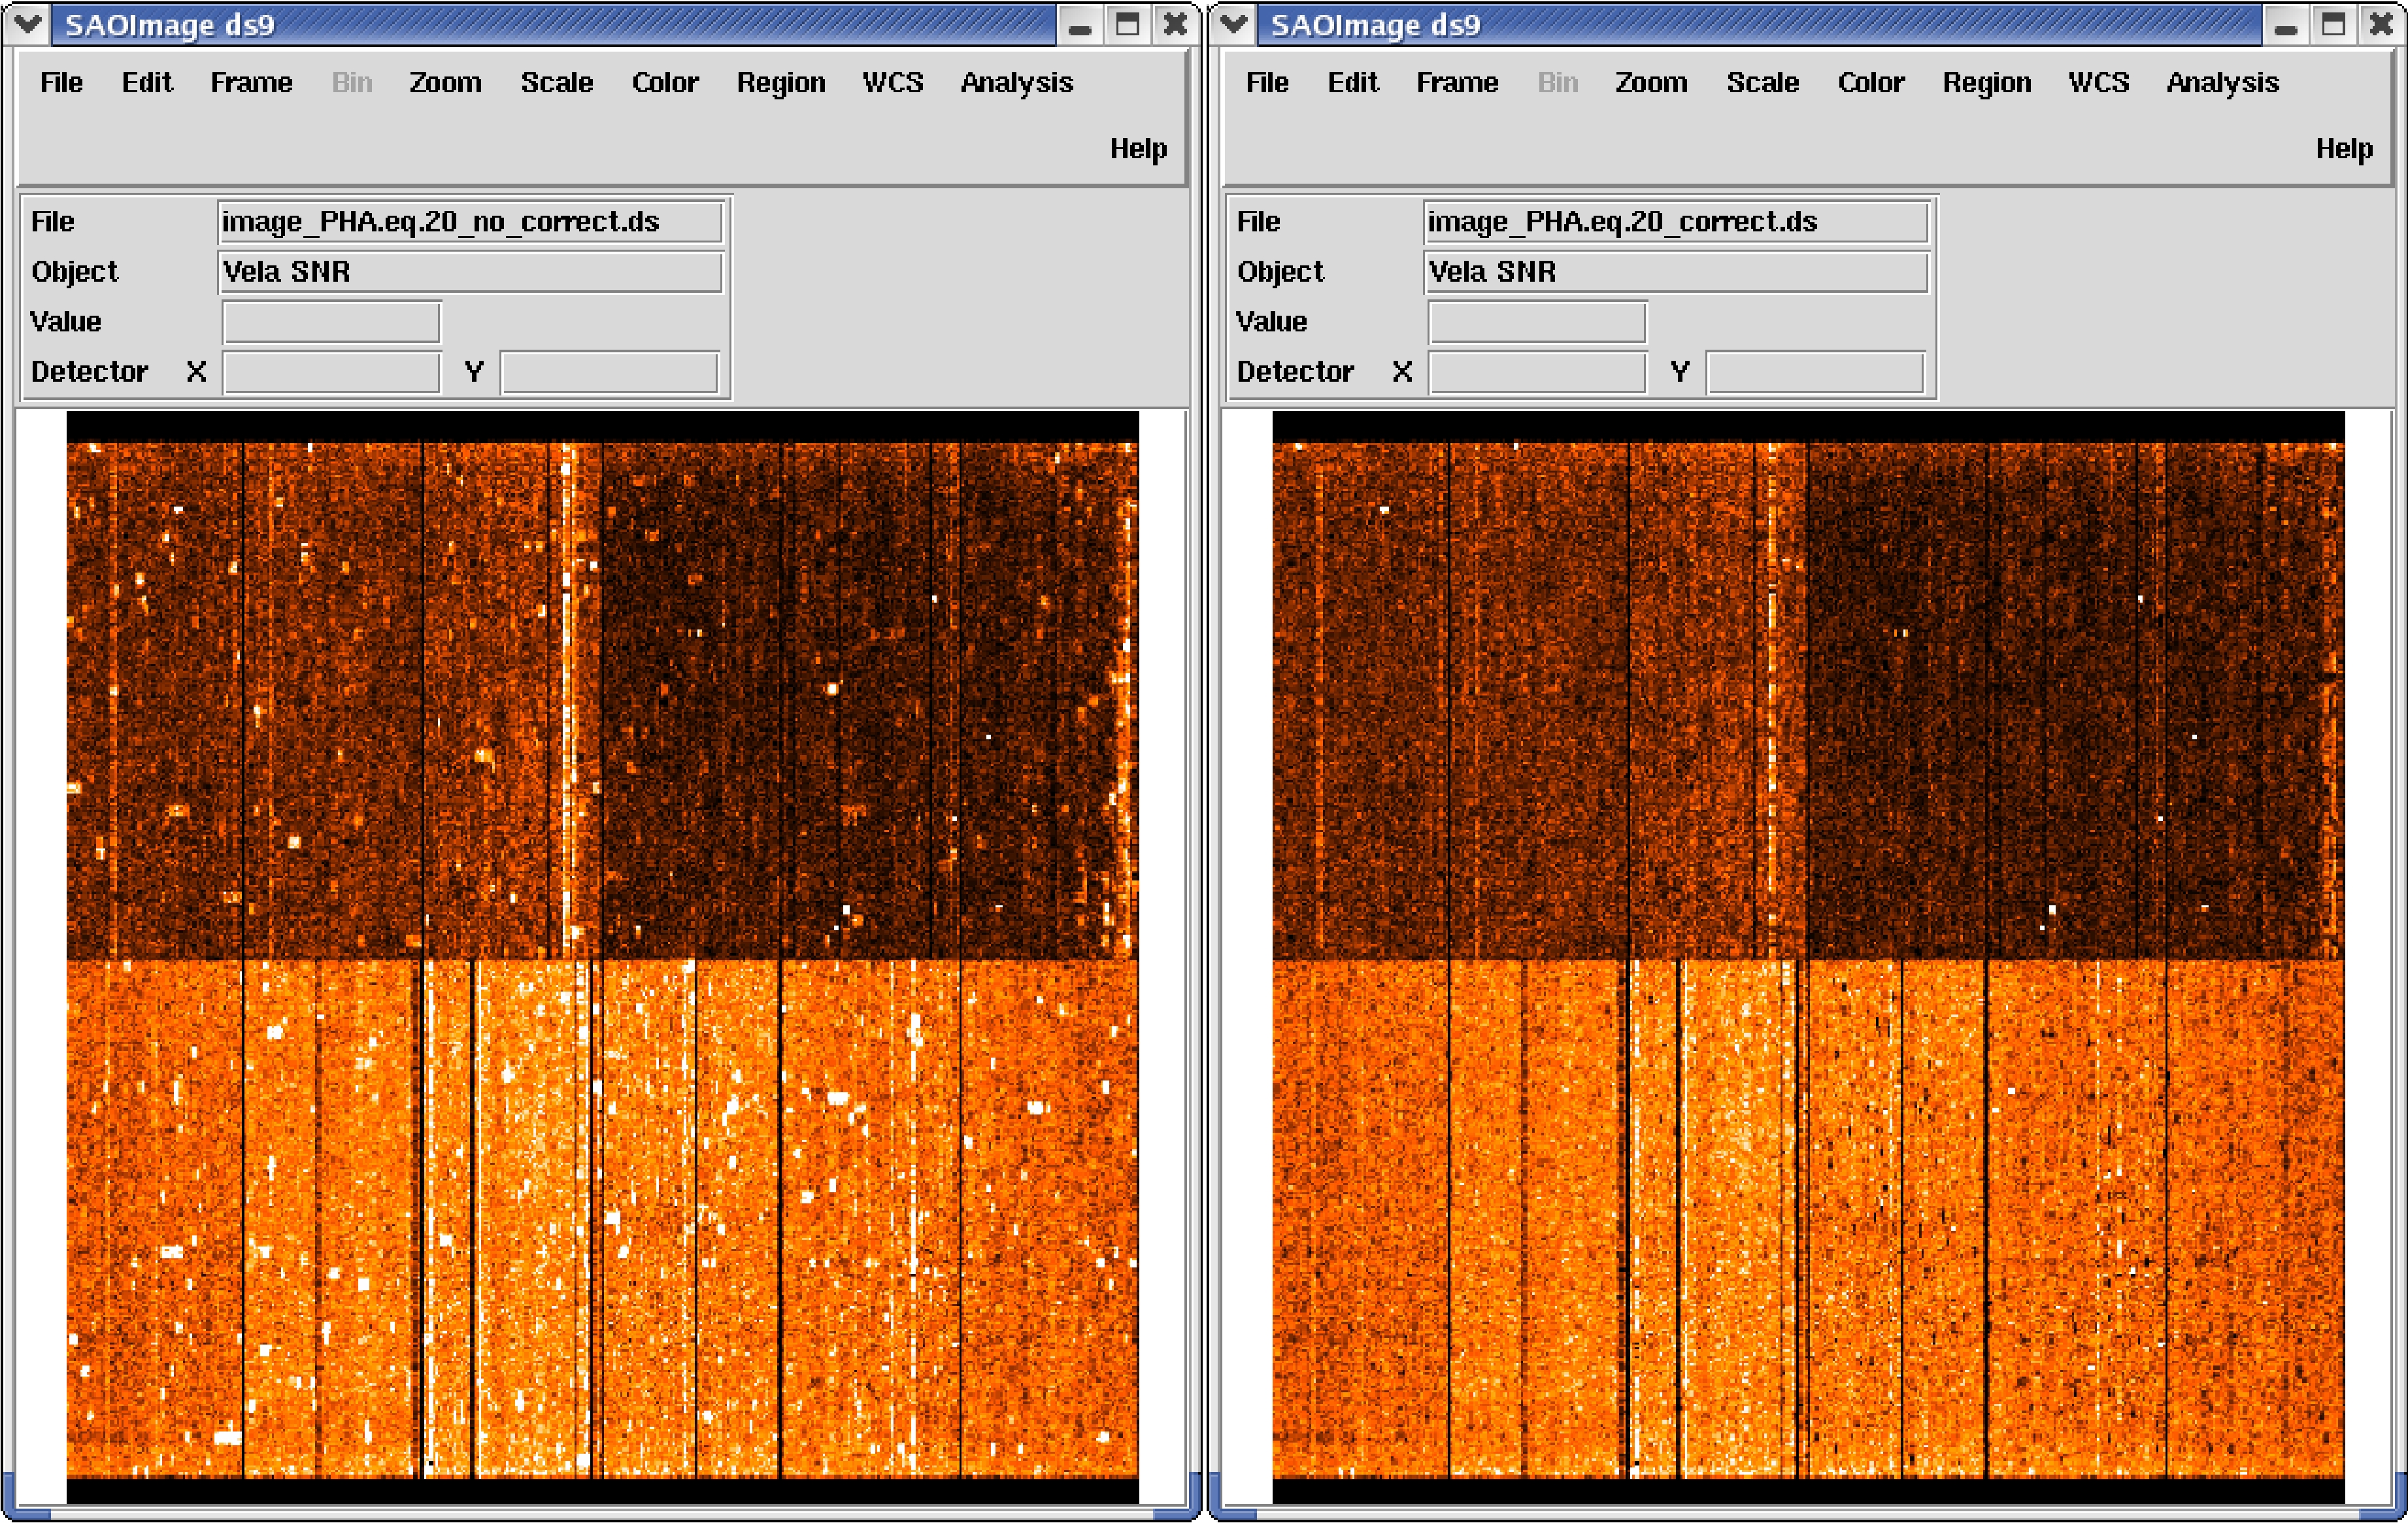
A comparison of images accumulated at the lowest transmitted amplitudes, before and after applying epreject, should directly show the improvement in image quality which can be obtained by this subtask (figure 13).
 |
Current restriction:
After a successful run of this task, the next step in data processing would be to remove events which have received amplitudes below 20 adu by this correction, in order to ensure a homogeneous treatment of all events. Otherwise, e.g., doubles with one component below 20 adu might show up in the recombined event list, although they would be considered as singles if they had occurred at a different location at the detector. Unfortunately, SAS does not support removal of events before epevents is applied. Thus, the only technique currently available to reject events below 20 adu is to filter the recombined event list for
Practical tips:
If one is only interested in correcting the energy scale in specific pixels, without using the noise suppression described in the next section, then the easiest application is to run epproc with the standard settings, adding just the epreject but canceling the treatment of the low-energy detector noise:
epproc runepreject=Y withnoisehandling=N
While there is practically no EPIC-pn detector noise
present at higher energies, X-ray data below ![]() 200 eV are
considerably contaminated by noise events. The noise properties of
EPIC-pn are fairly stable in time, but vary with position and
energy. This fact complicates the background subtraction at low
energies, which must take both
the presence of cosmic diffuse X-ray background ("sky background")
and detector noise into account.
200 eV are
considerably contaminated by noise events. The noise properties of
EPIC-pn are fairly stable in time, but vary with position and
energy. This fact complicates the background subtraction at low
energies, which must take both
the presence of cosmic diffuse X-ray background ("sky background")
and detector noise into account.
Compared to the sky background, the detector background is characterized by
A further interesting consequence of this subtask is an improved treatment of
out-of-time events. As described in § 4.9, such events can be
suppressed by constructing an out-of-time event file from the original data
set and subtracting a binned version of this data set (spectrum or image),
appropriately scaled, from the original data. The out-of-time event file is
produced by randomly shifting the patterns along the RAWY axis and performing
the gain and CTI corrections after-wards. This method works well for energies
above ![]() 250 eV. At lower energies, however, the detector noise is
steeply rising toward the rows closest to the CAMEX. Thus, the technique of
randomly shifting the patterns along the RAWY axis also spreads this noise
over the column. This can be avoided if the events flagged as noise events by
epreject are removed from the data set before producing the
out-of-time event file.
250 eV. At lower energies, however, the detector noise is
steeply rising toward the rows closest to the CAMEX. Thus, the technique of
randomly shifting the patterns along the RAWY axis also spreads this noise
over the column. This can be avoided if the events flagged as noise events by
epreject are removed from the data set before producing the
out-of-time event file.
Contrary to the subtask for correcting the energy scale in specific pixels, where the default setting usually leads to reasonable results, the complexity of the noise suppression may require a fine-tuning of some settings, in order to take slight temporal changes of the detector noise into account. It is important to keep in mind that epreject will usually flag more than half of all the events as noise events and that the result will respond very sensitively to any change of the flagging criteria.
Parameters which can be set by the user:
There are 13 parameters which can be set by the user: a cutoff parameter and 12 chip specific correction factors, all contained in the array noiseparameters.
The cutoff parameter controls the maximum percentage of events in the CCFs derived from exposures with the filter wheel closed, which may be considered as noise. This parameter should be set to a value which is slightly below 100% (default: 98%), to take the fact into account that even in these exposures not all events are due to noise. There is, e.g., some additional flux present from fluorescence of the filter wheel itself, triggered by energetic particles. This component would change with the position of the filter wheel. The tests which were done so far indicate that this parameter can usually be left at its default value.
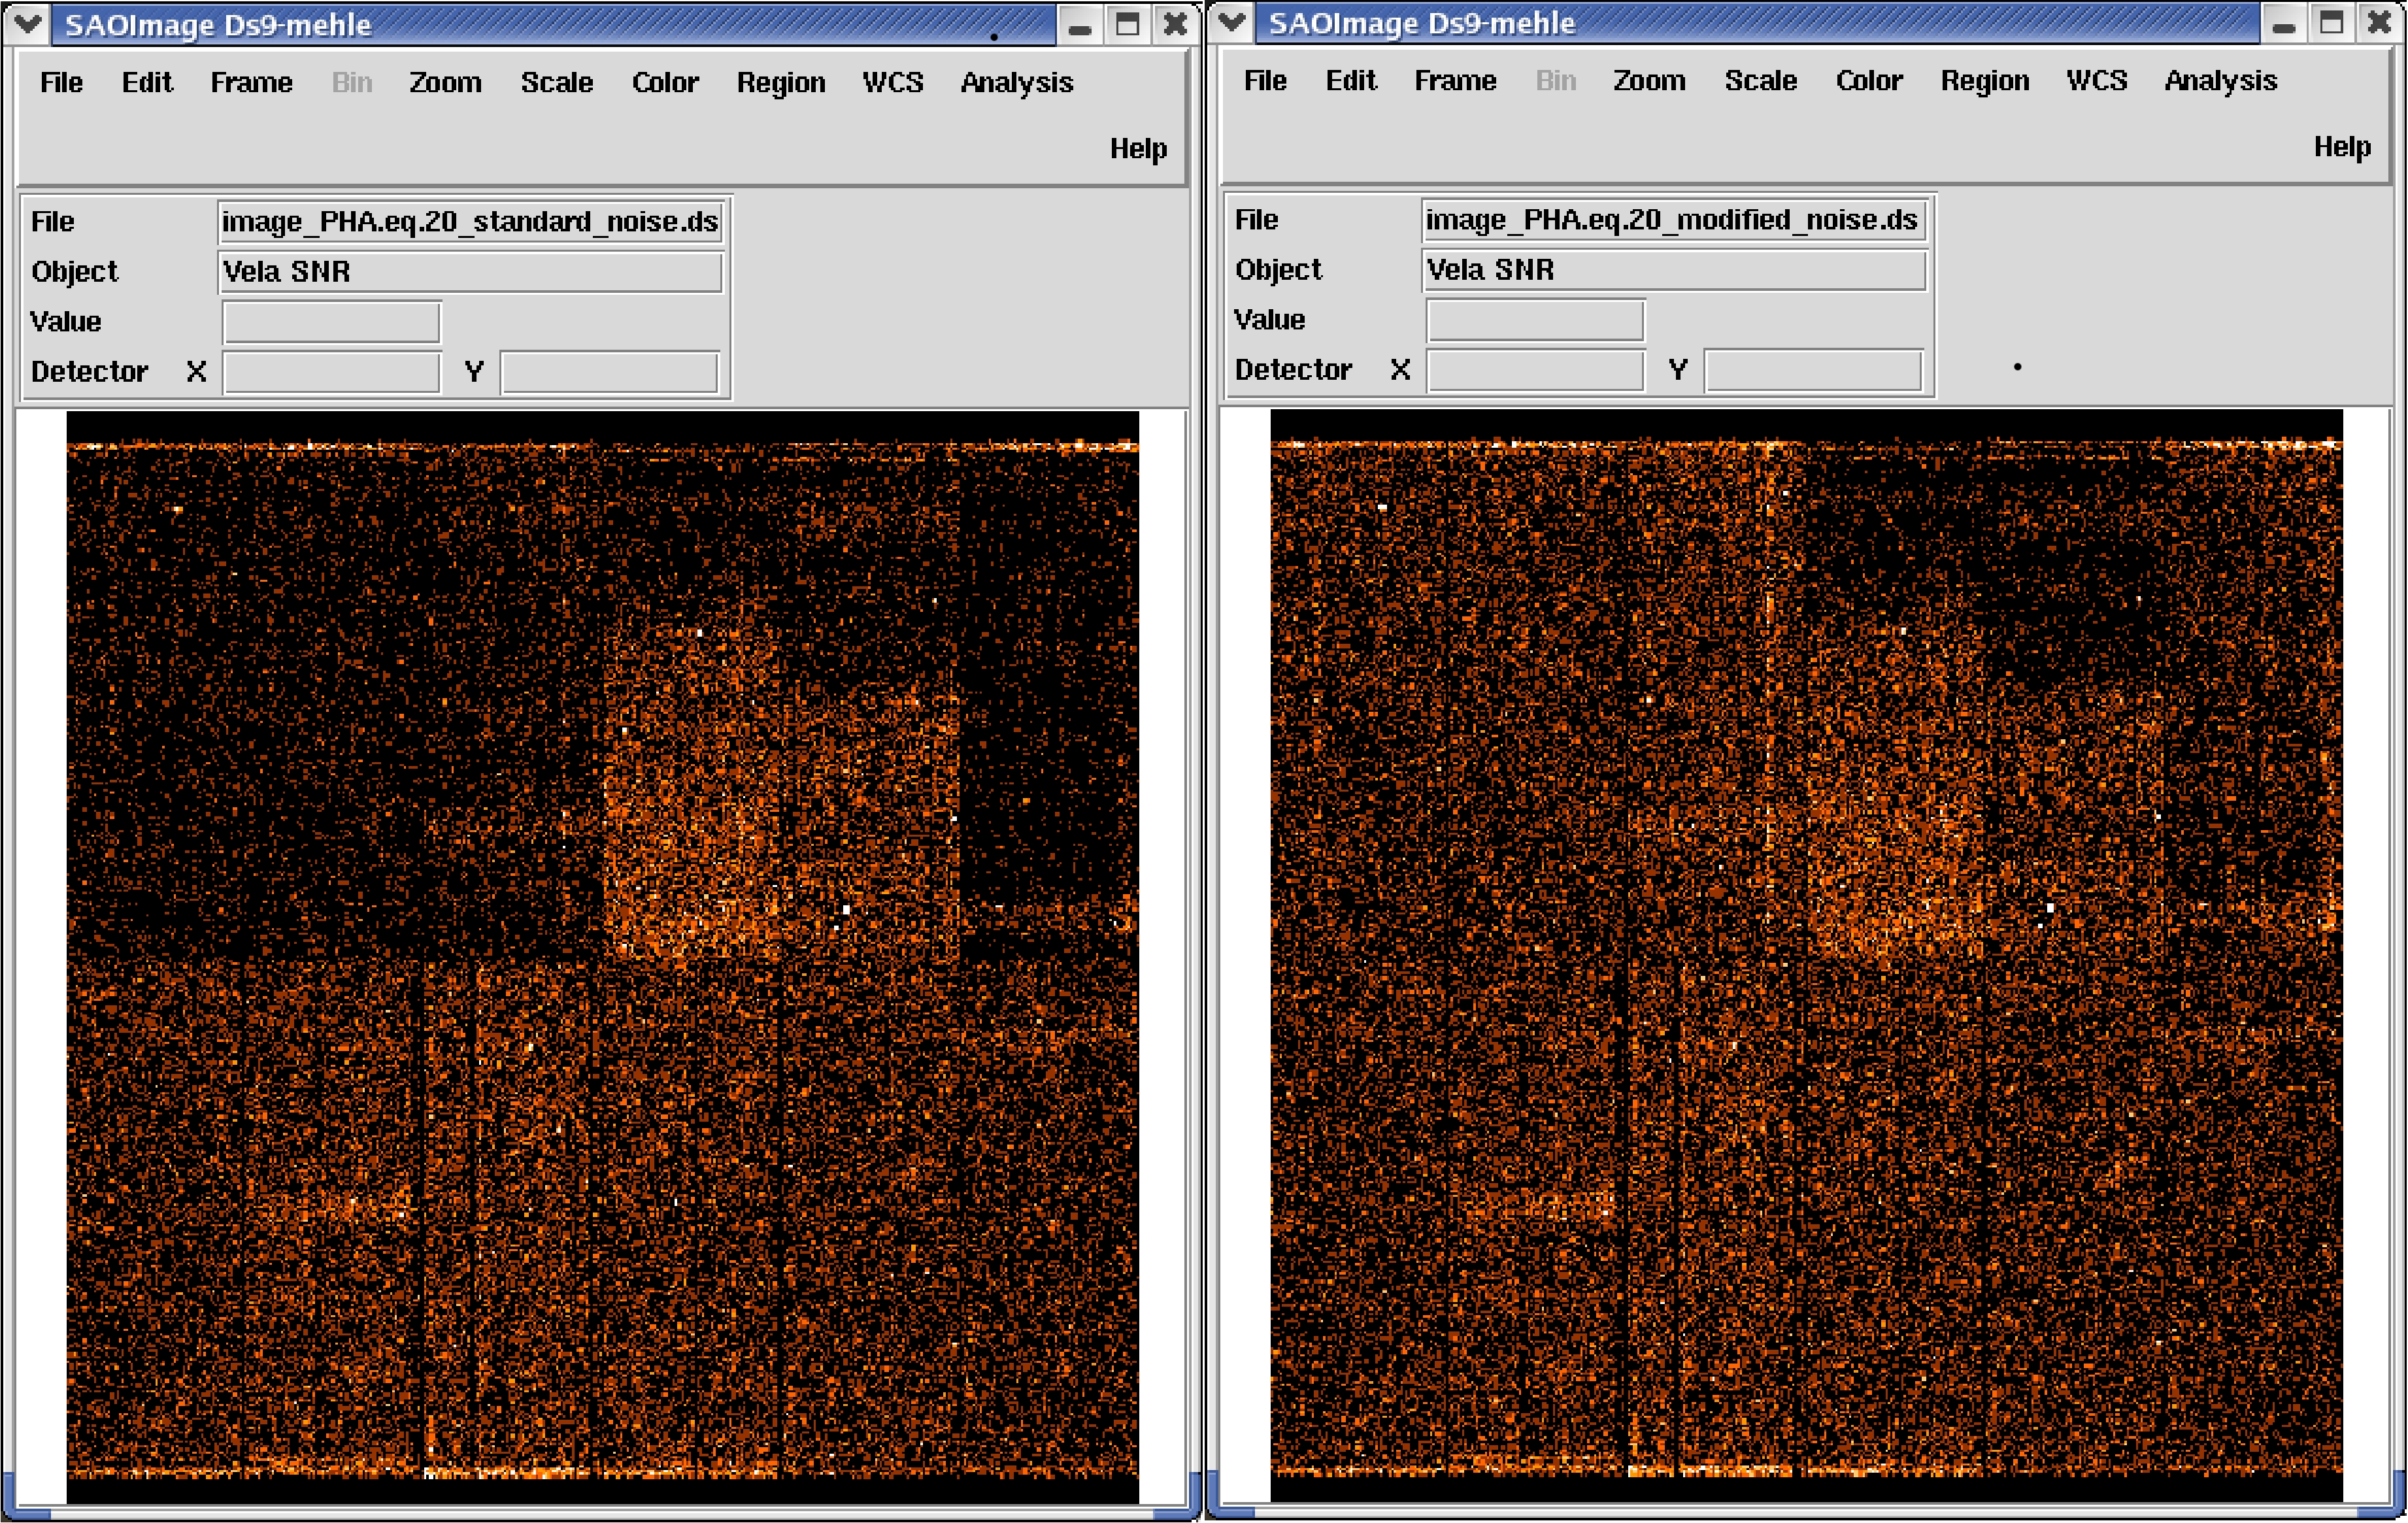
The 12 chip specific correction factors control the relative amount of noise in each CCD. These parameters may require some adjustment, in order to take slight temporal variations of the detector noise into account. These variations are often similar for all CCDs of each quadrant. The default value for all CCDs is 1.0. Increasing this number will increase the percentage of events which will be considered as noise events. Changes of these values by a few percent should be sufficient in most cases. An example of how these parameters work is shown in figure 14. The recommended way for finding the appropriate setting of these parameters is by iteration, starting with the default setting, and controlling the image which is accumulated from "no-noise" 20 adu events for homogeneity (figure 14).
 |
These tips are demonstrated on a specific example. The data set used for this purpose is a 33.9 ks observation (in rev. 367) of the Vela SNR, an extended soft X-ray source, which was performed in fullframe mode with the medium filter.
epreject operates individually on each of the 12 CCD specific event files, which can be produced by running epframes 12 times, e.g.,
epframes set=0367_0137550901_PNS00301IME.FIT eventset=rawevents01.dat gtiset=gti01.dat
...
epframes set=0367_0137550901_PNS00312IME.FIT eventset=rawevents12.dat gtiset=gti12.dat
This method will produce the files rawevents01.dat ...rawevents12.dat, which can then be analysed directly with epreject:
epreject eventset=rawevents01.dat withnoisehandling=Y sigma=.. noiseparameters=".."
 ..
epreject eventset=rawevents12.dat withnoisehandling=Y sigma=.. noiseparameters=".."
This process will add the columns OFF_COR and NOISE to the files rawevents01.dat .. rawevents12.dat, where the NOISE = 1 flag marks events which were considered as having been caused by detector noise (otherwise NOISE = 0). The column OFF_COR contains the adu values which were subtracted from the PHA values in order to readjust the energy scale in specific pixels. This column is present for the purpose of information and in order to avoid multiple corrections if epreject is run several times. As epreject has no destructive effect on the event file, it can be run repeatedly on the same file; the original information will be automatically restored at the beginning of this task.
Please note that, when epreject is called directly, all 12 CCD specific noise correction factors have to be given in each of the 12 epreject commands, although only one of them will be used in each command.
From the 12 rawevents*.dat files, images can be binned which contain only the "no-noise" events at the lowest transmitted energies (where such checks are most sensitive), e.g.:
evselect table=rawevents01.dat withimageset=true imageset=i01.fits \
         xcolumn=RAWX ycolumn=RAWY \
         imagebinning=binSize ximagebinsize=1 yimagebinsize=1 \
         expression="PHA.eq.20 .and. NOISE.eq.0"
Such images (for all 12 CCDs) should contain a similar density of events in
the regions which are free from bright X-ray sources.
In this example (figure 14, right), a reasonable parameter
setting was found to be
noiseparameters="0.98 0.97 0.97 0.97 1.0 1.01 0.96 1.0 1.0 1.0 1.0 1.0 1.0".
This assigns noise flags to the following percentage values of all events:
42.5% 48.8% 59.9% 21.9% 29.1% 42.7% 57.4% 57.1% 61.9% 69.7% 74.6%
79.4%
For comparison, the default setting noiseparameters="0.98 1.0 1.0 1.0 1.0 1.0 1.0 1.0 1.0 1.0 1.0 1.0 1.0" flags the following percentages of events as noise, for CCDs 1-6: 43.8% 50.3% 61.8% 21.9% 28.8% 44.5% (figure 14, left).
These percentages vary from observation to observation. If there are no bright X-ray sources in the field of view, they can be considerably higher.
Once an appropriate setting has been found, the full epproc can be run with these settings, e.g.:
epproc runepreject=Y withnoisehandling=Y sigma=4.0 \
      noiseparameters="0.98 0.97 0.97 0.97 1.0 1.01 0.96 1.0 1.0 1.0 1.0 1.0 1.0" \
      filterevents=Y filterexpression="#XMMEA_EP .and. PI.gt.0. .and. PHA.ge.20"
The filterexpression ensures that no events are removed regardless
of their energy (unless they are regarded as noise events). This will
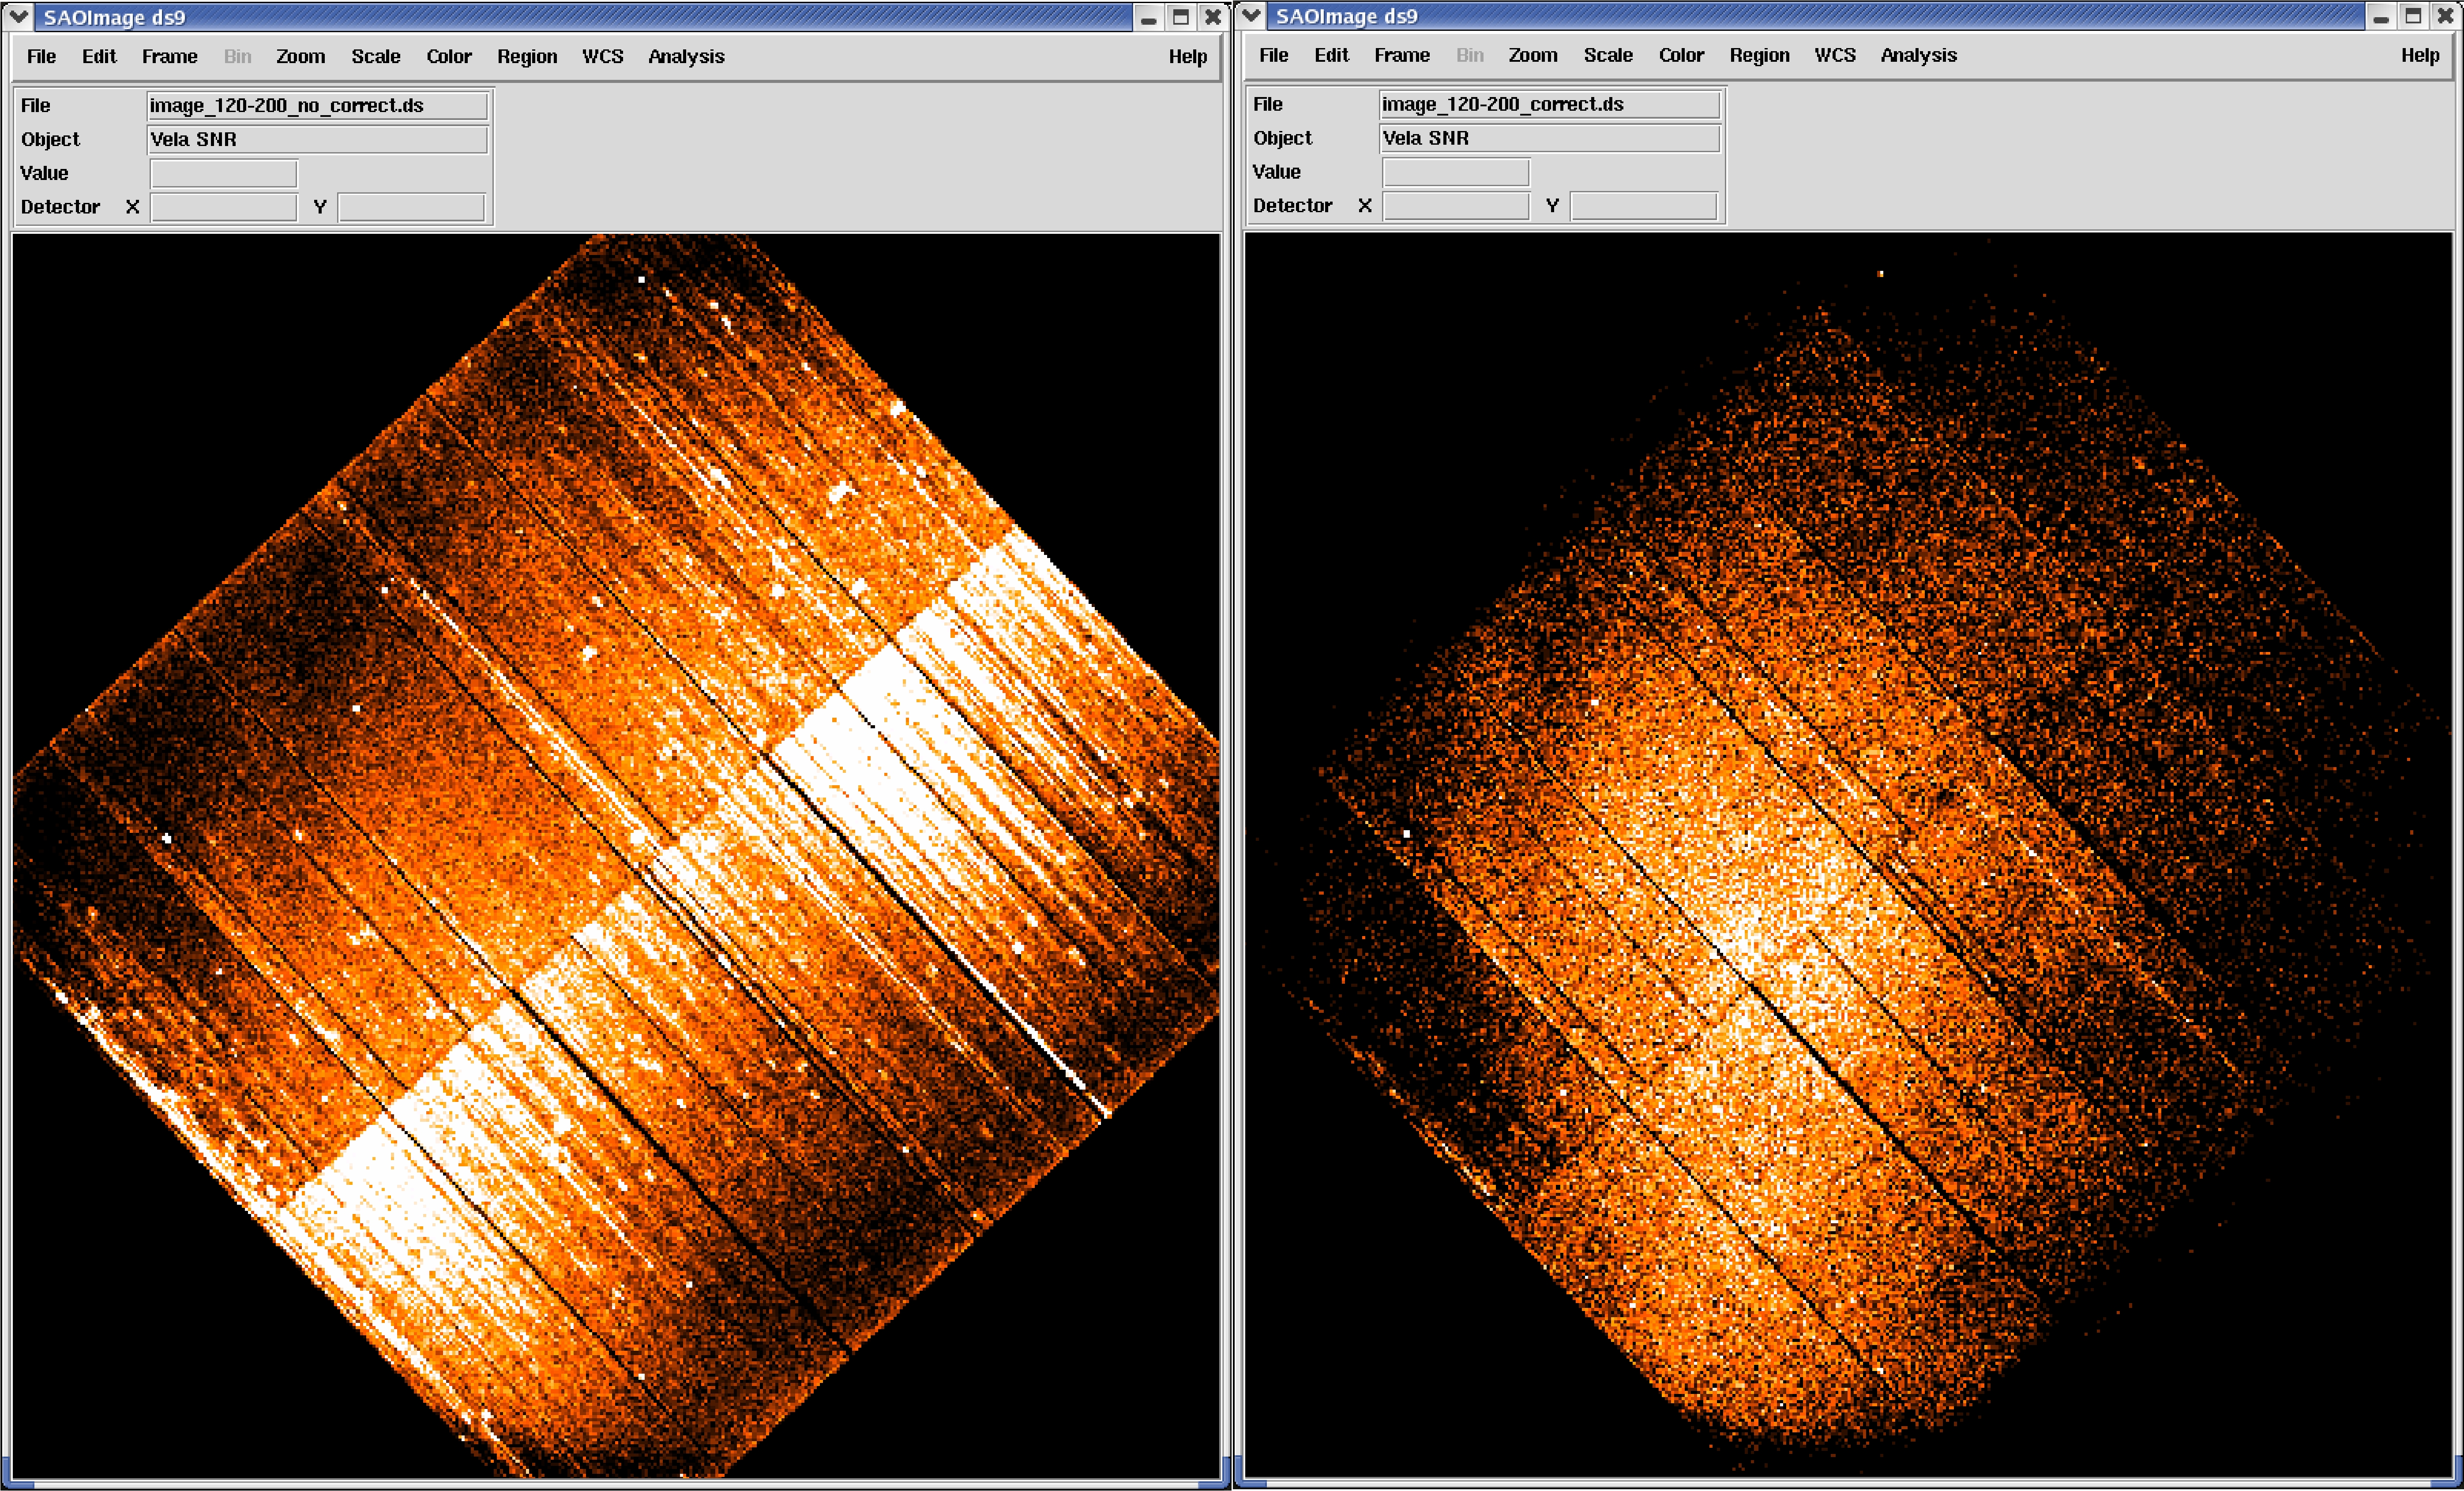
allow to extend the useful energy range down to In figure 15 Vela SNR images in the very soft (120 - 200 eV) energy band processed without and with epreject are shown. This demonstrate the type of data quality improvement that one can expect to achieve for imaging mode EPIC pn data. Both images were produced with the following command (see § 4.7 for details on the generation of EPIC images):
evselect table=P0137550901PNS003PIEVLI0000.FIT withimageset=true \
         imageset=image.fits xcolumn=X ycolumn=Y \
         imagebinning=binSize ximagebinsize=100 yimagebinsize=100 \
         expression="PHA.ge.20 .and. PI.gt.120 .and. PI.lt.200"
 |
European Space Agency - XMM-Newton Science Operations Centre