Next: 5.7.2 Generating raw RGS light curves to assess the background Up: 5.7 The use of xmmselect on RGS data Previous: 5.7 The use of xmmselect on RGS data
|
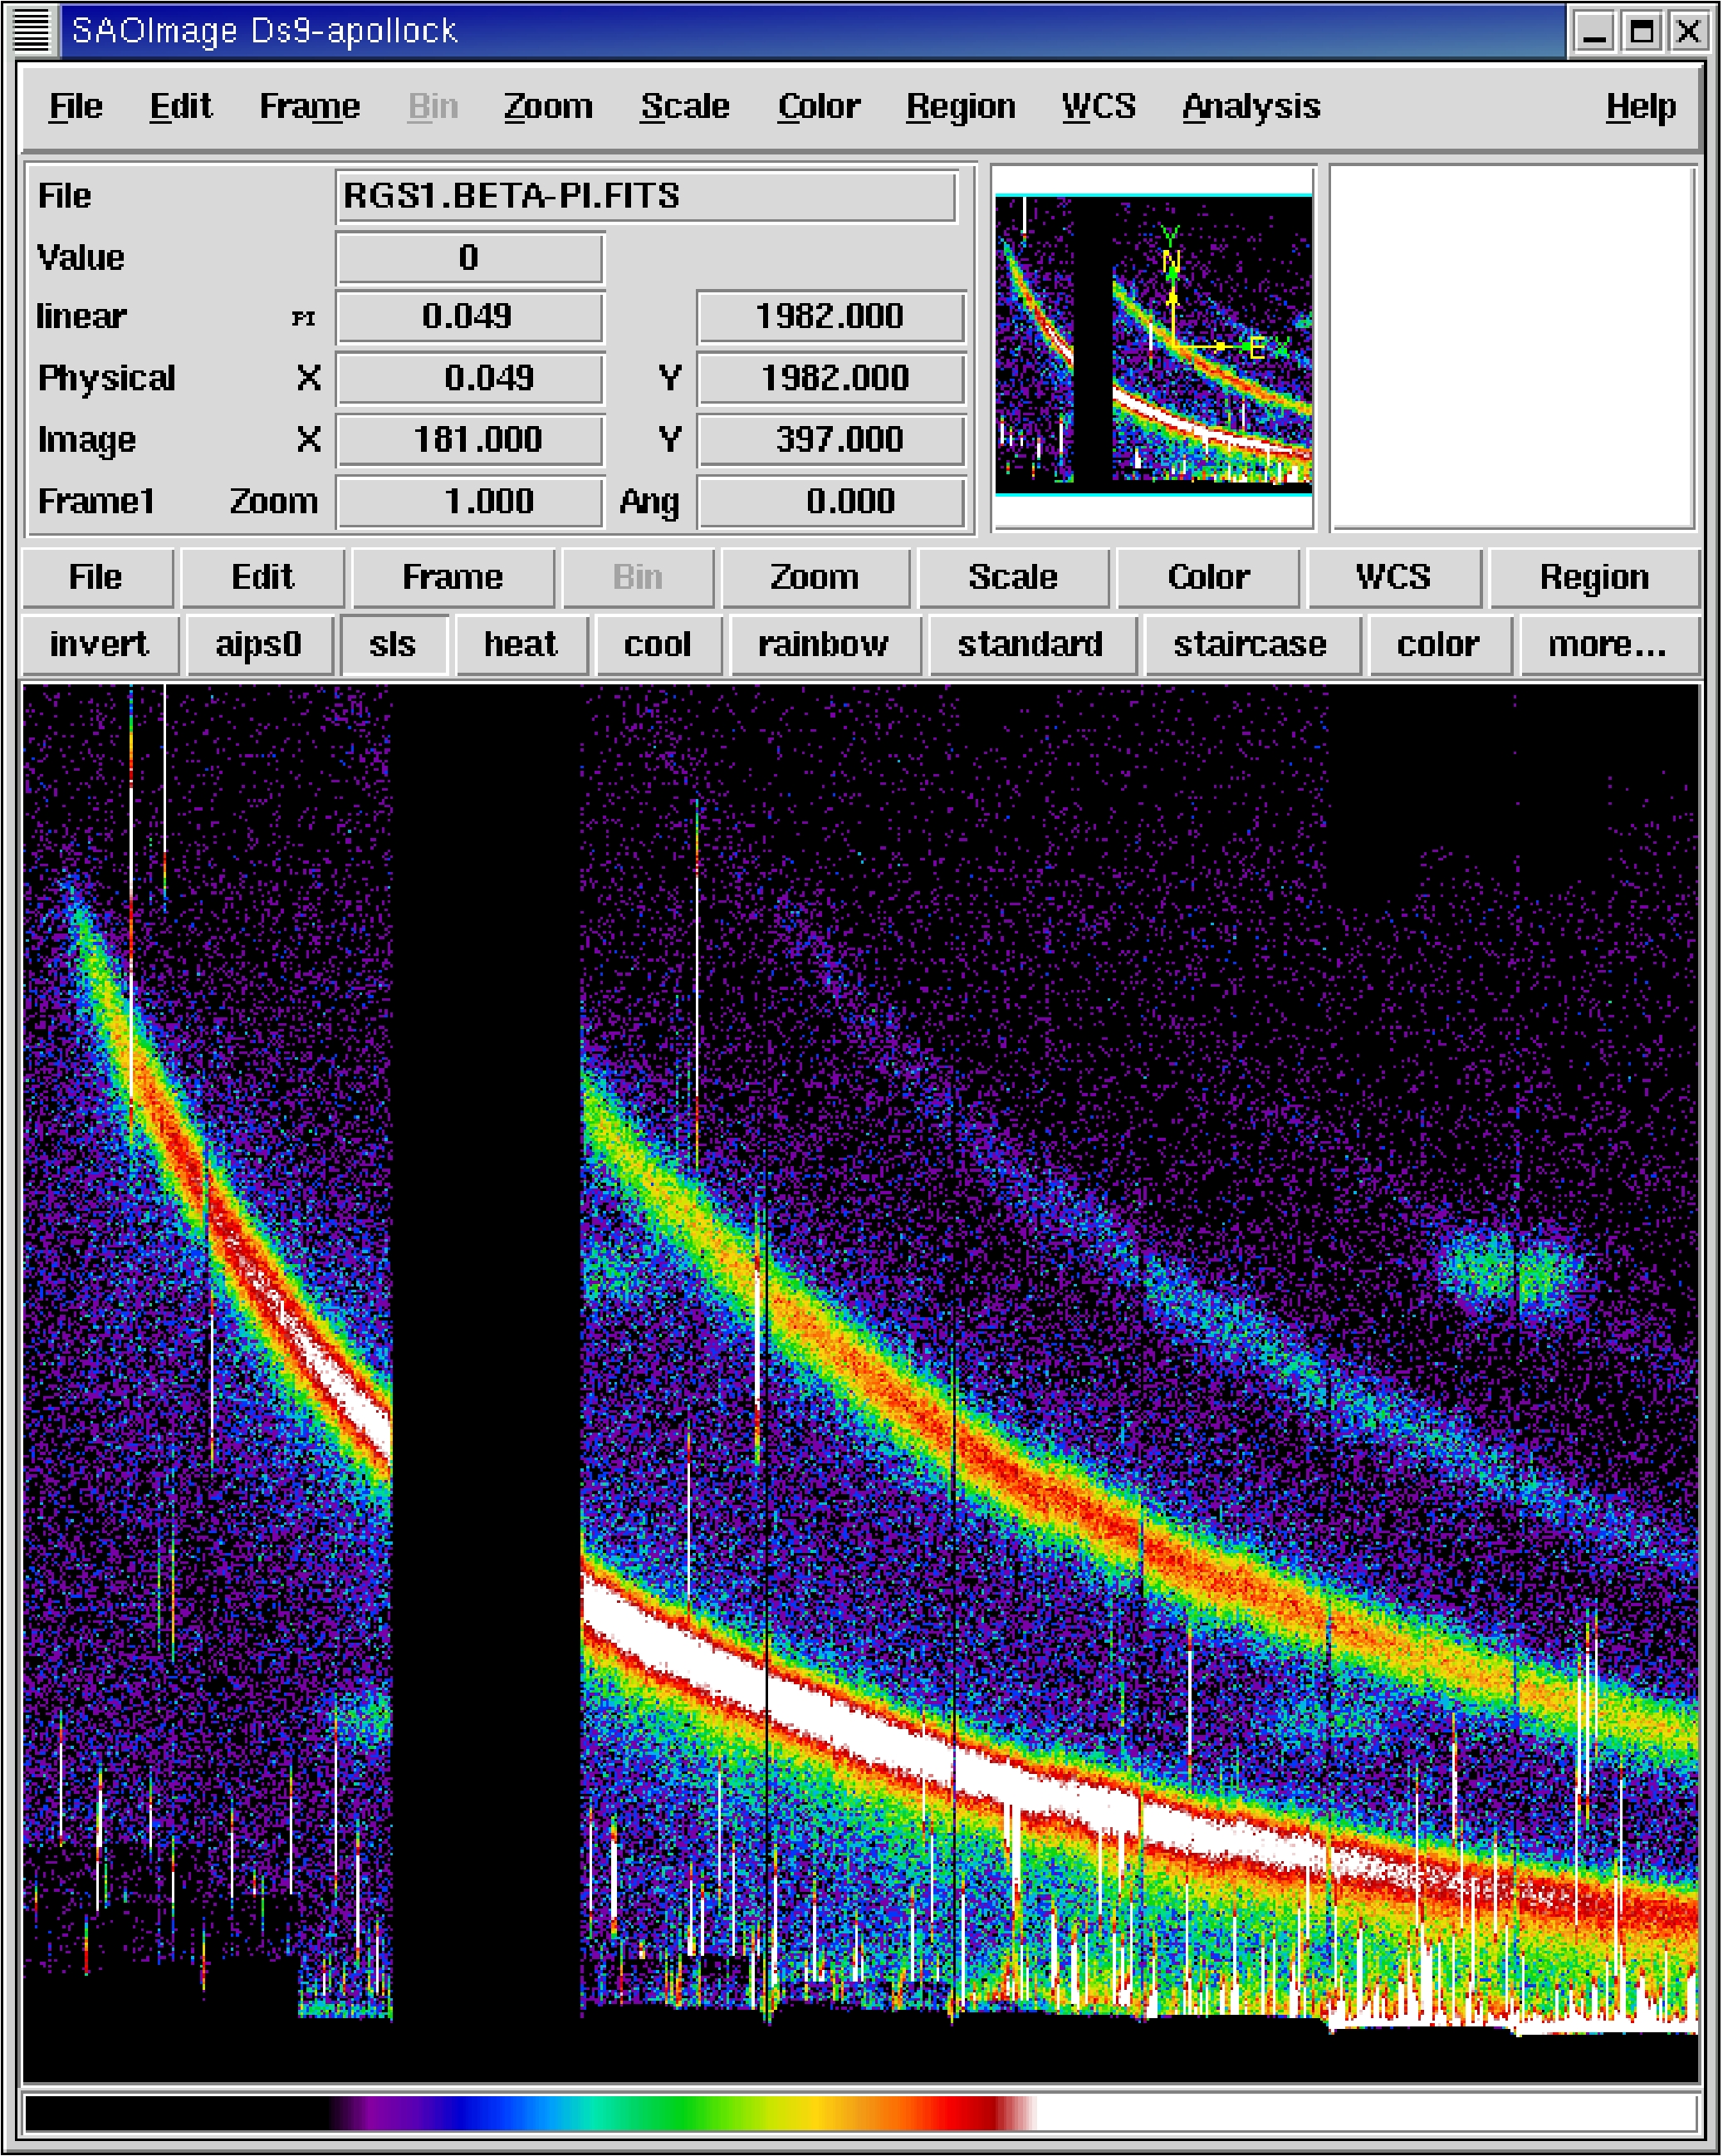
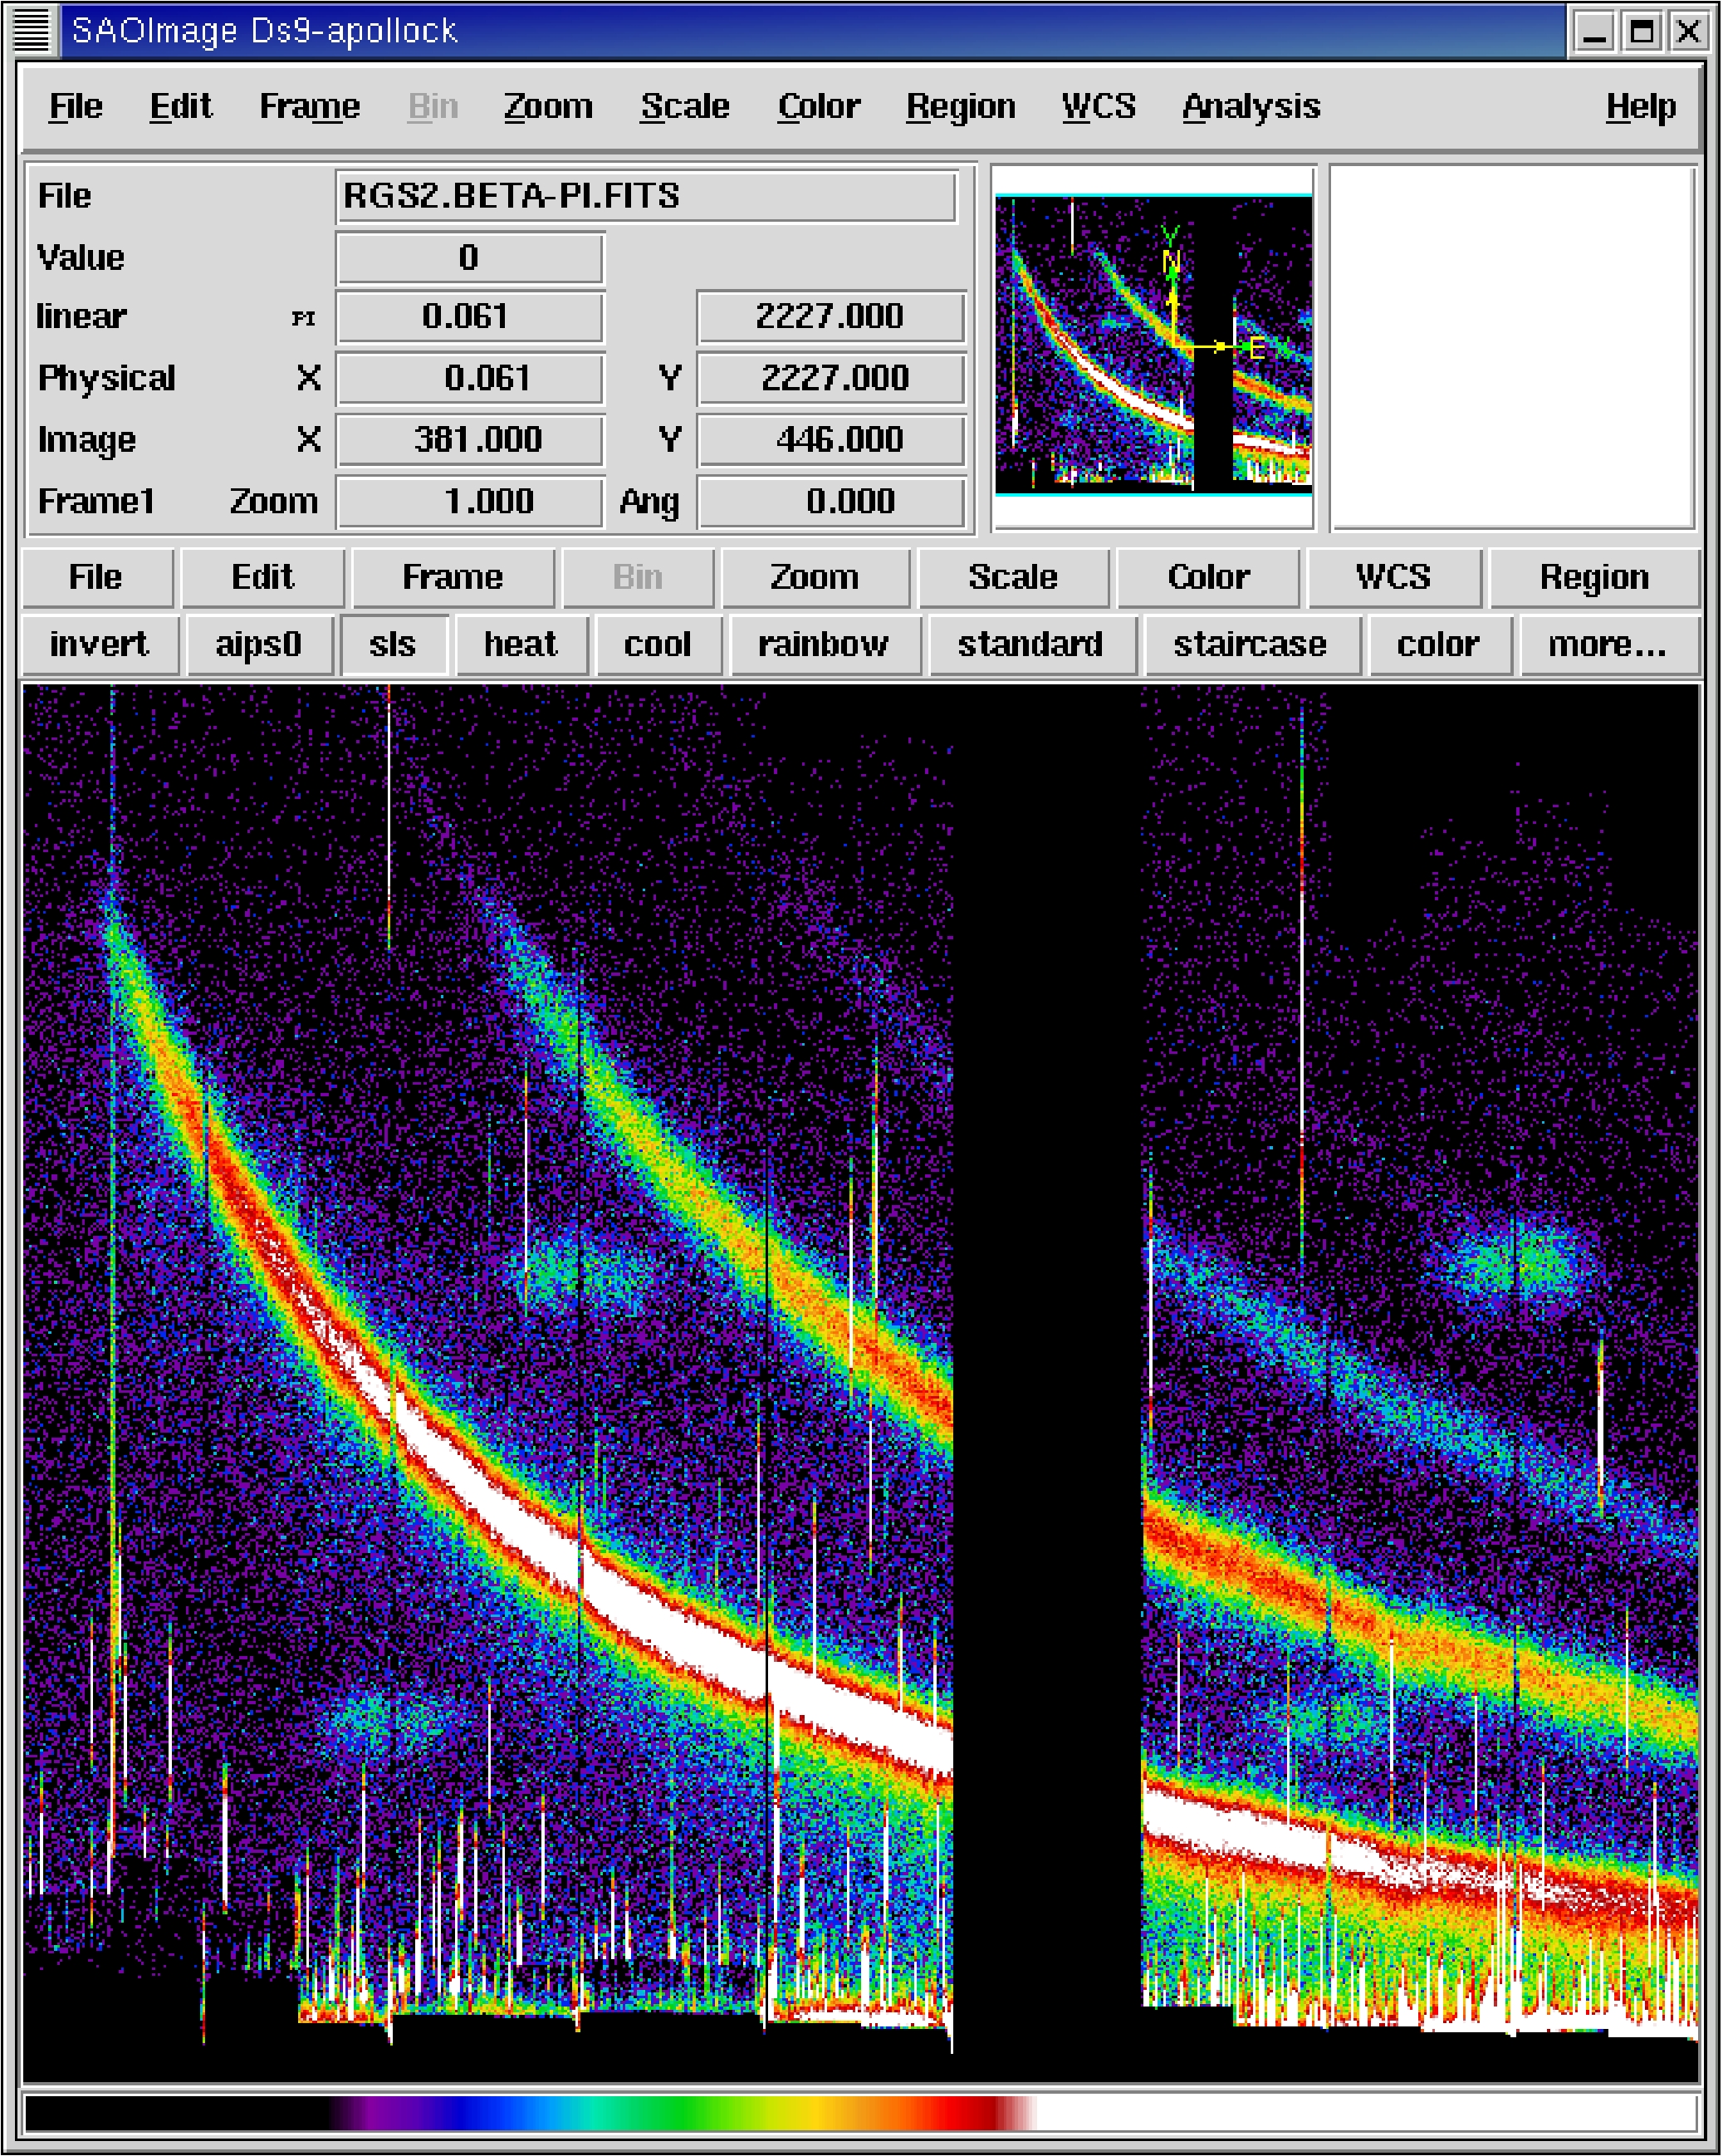
Once the axes have been selected and any selection criteria specified, clicking the Image button initiates dialogue panels that include an Image section like the one shown in Fig. 40 which gives the opportunity to review the choices made. The MLAMBDA/PI images, commonly known as banana plots, are improved by overruling the default y-range by checking the withyranges box and setting, e.g. yimagemin=0, yimagemax=2500.
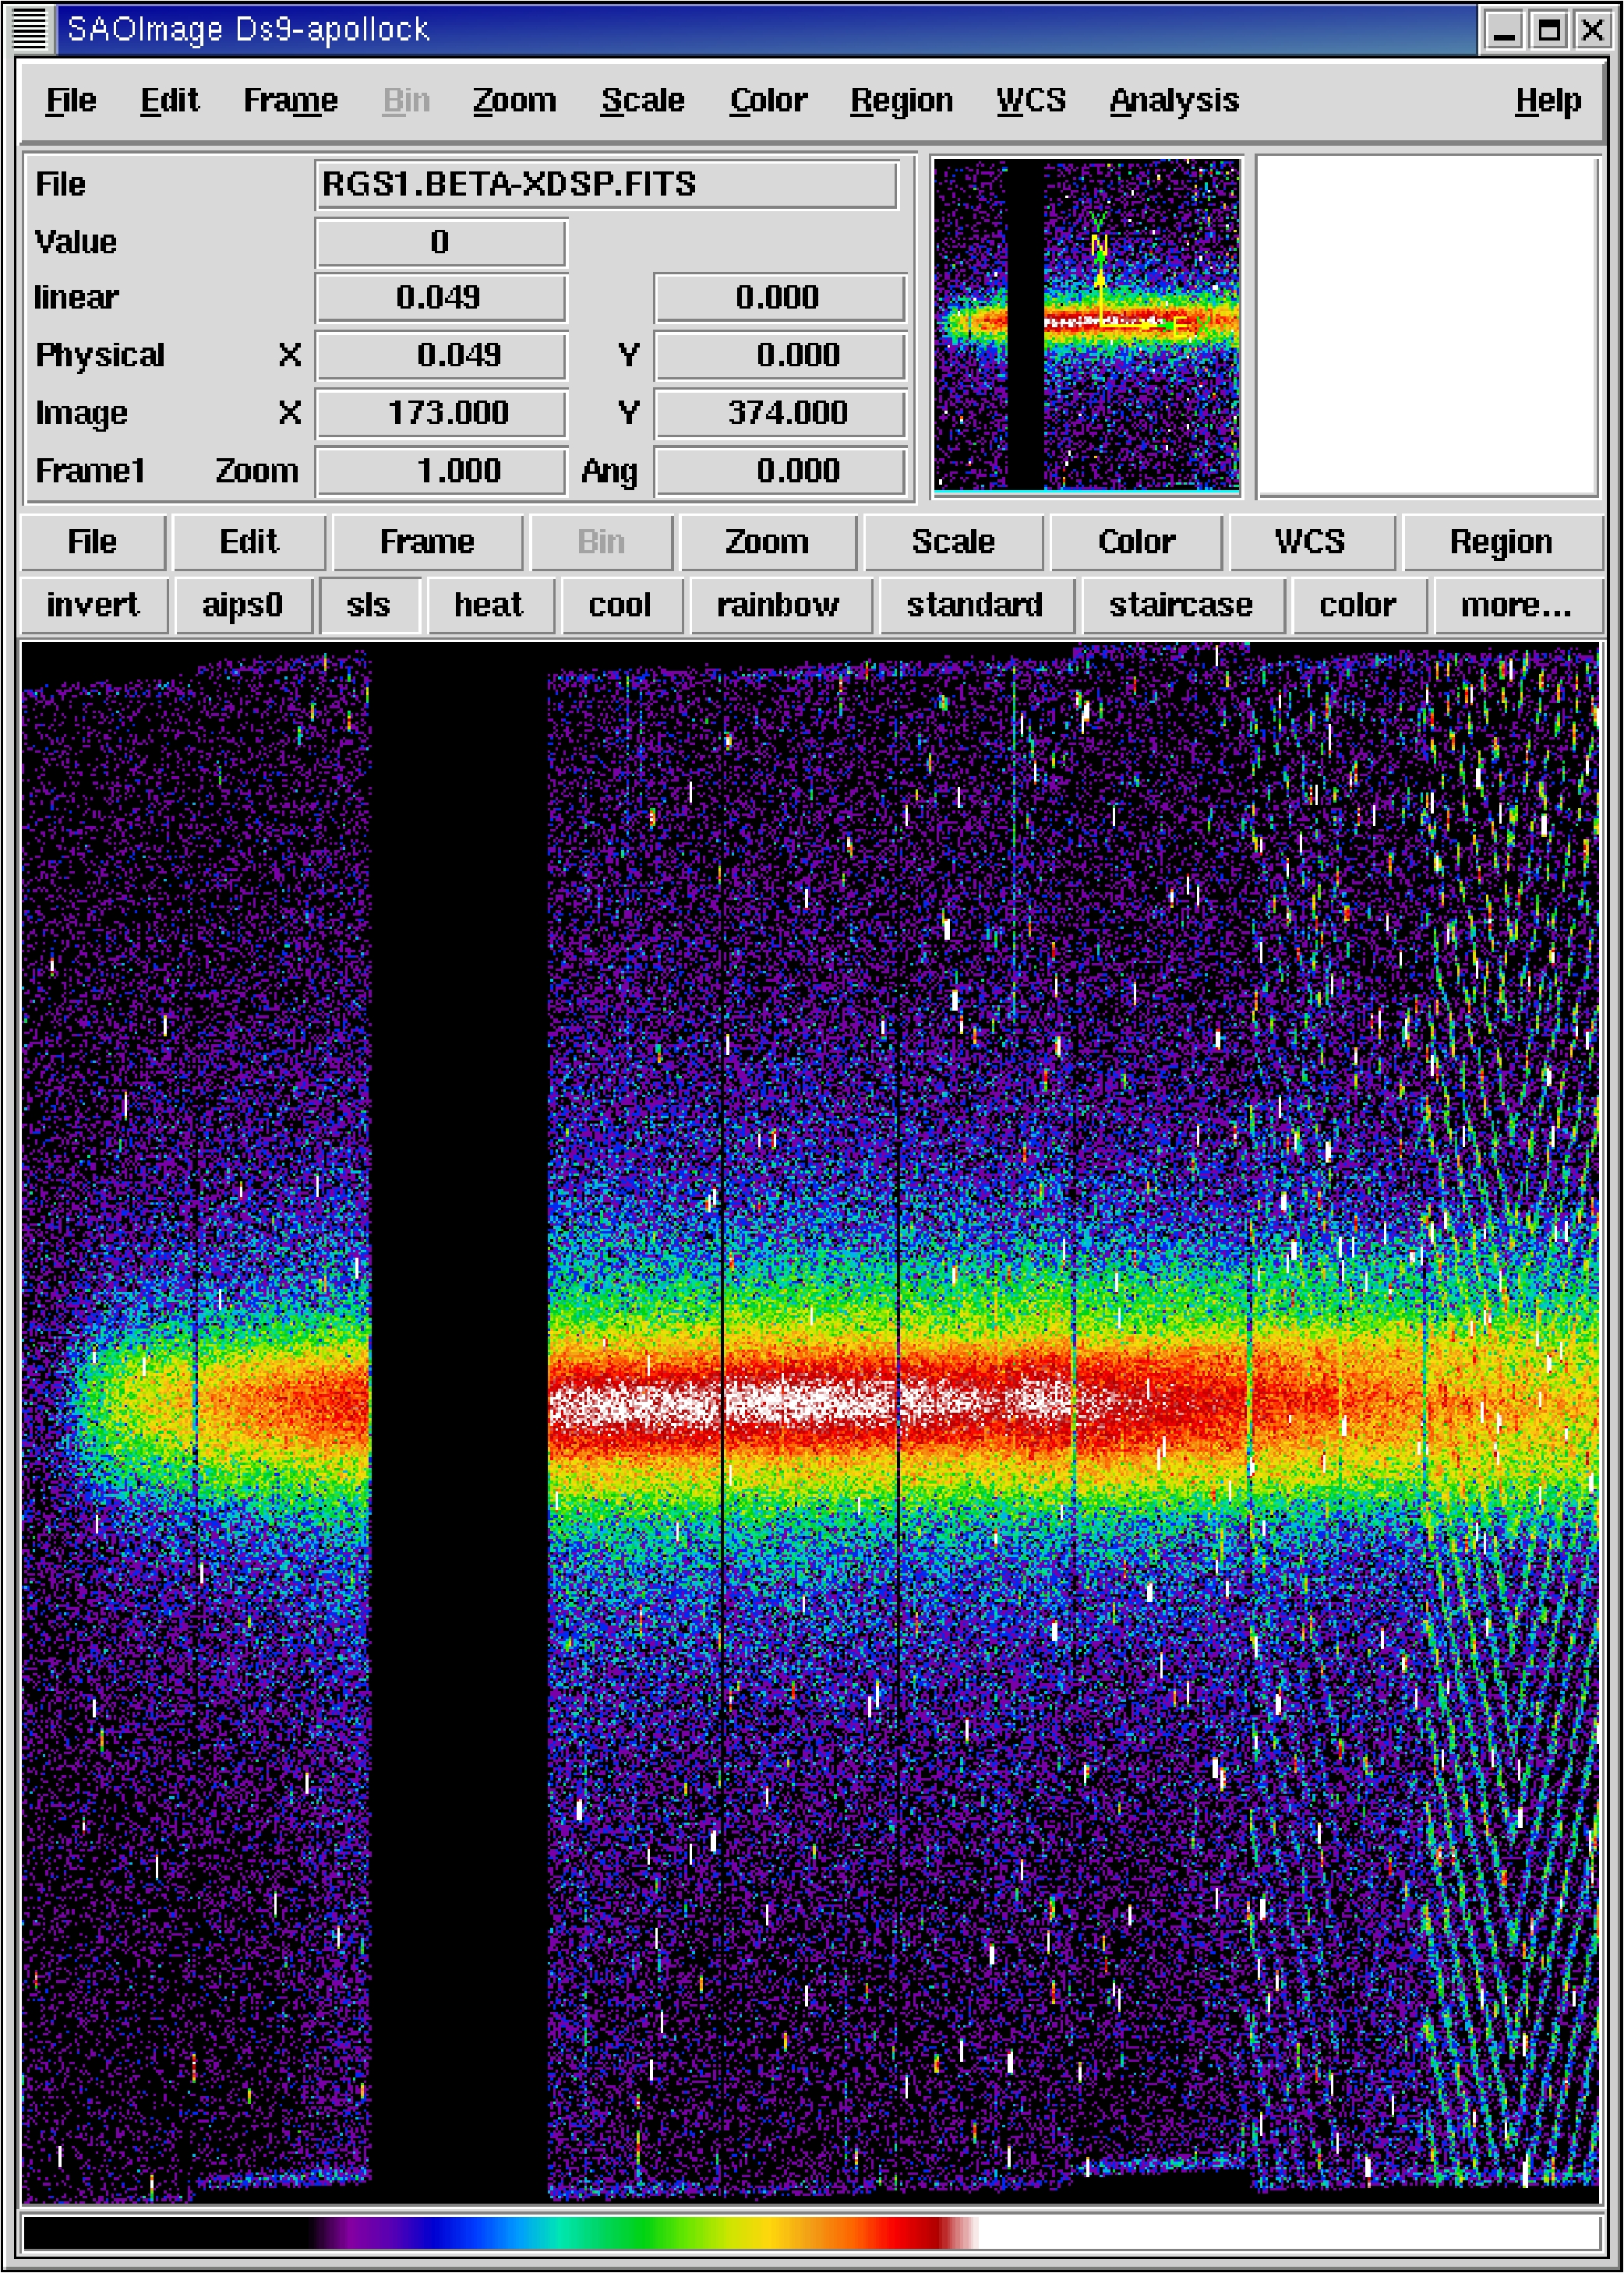
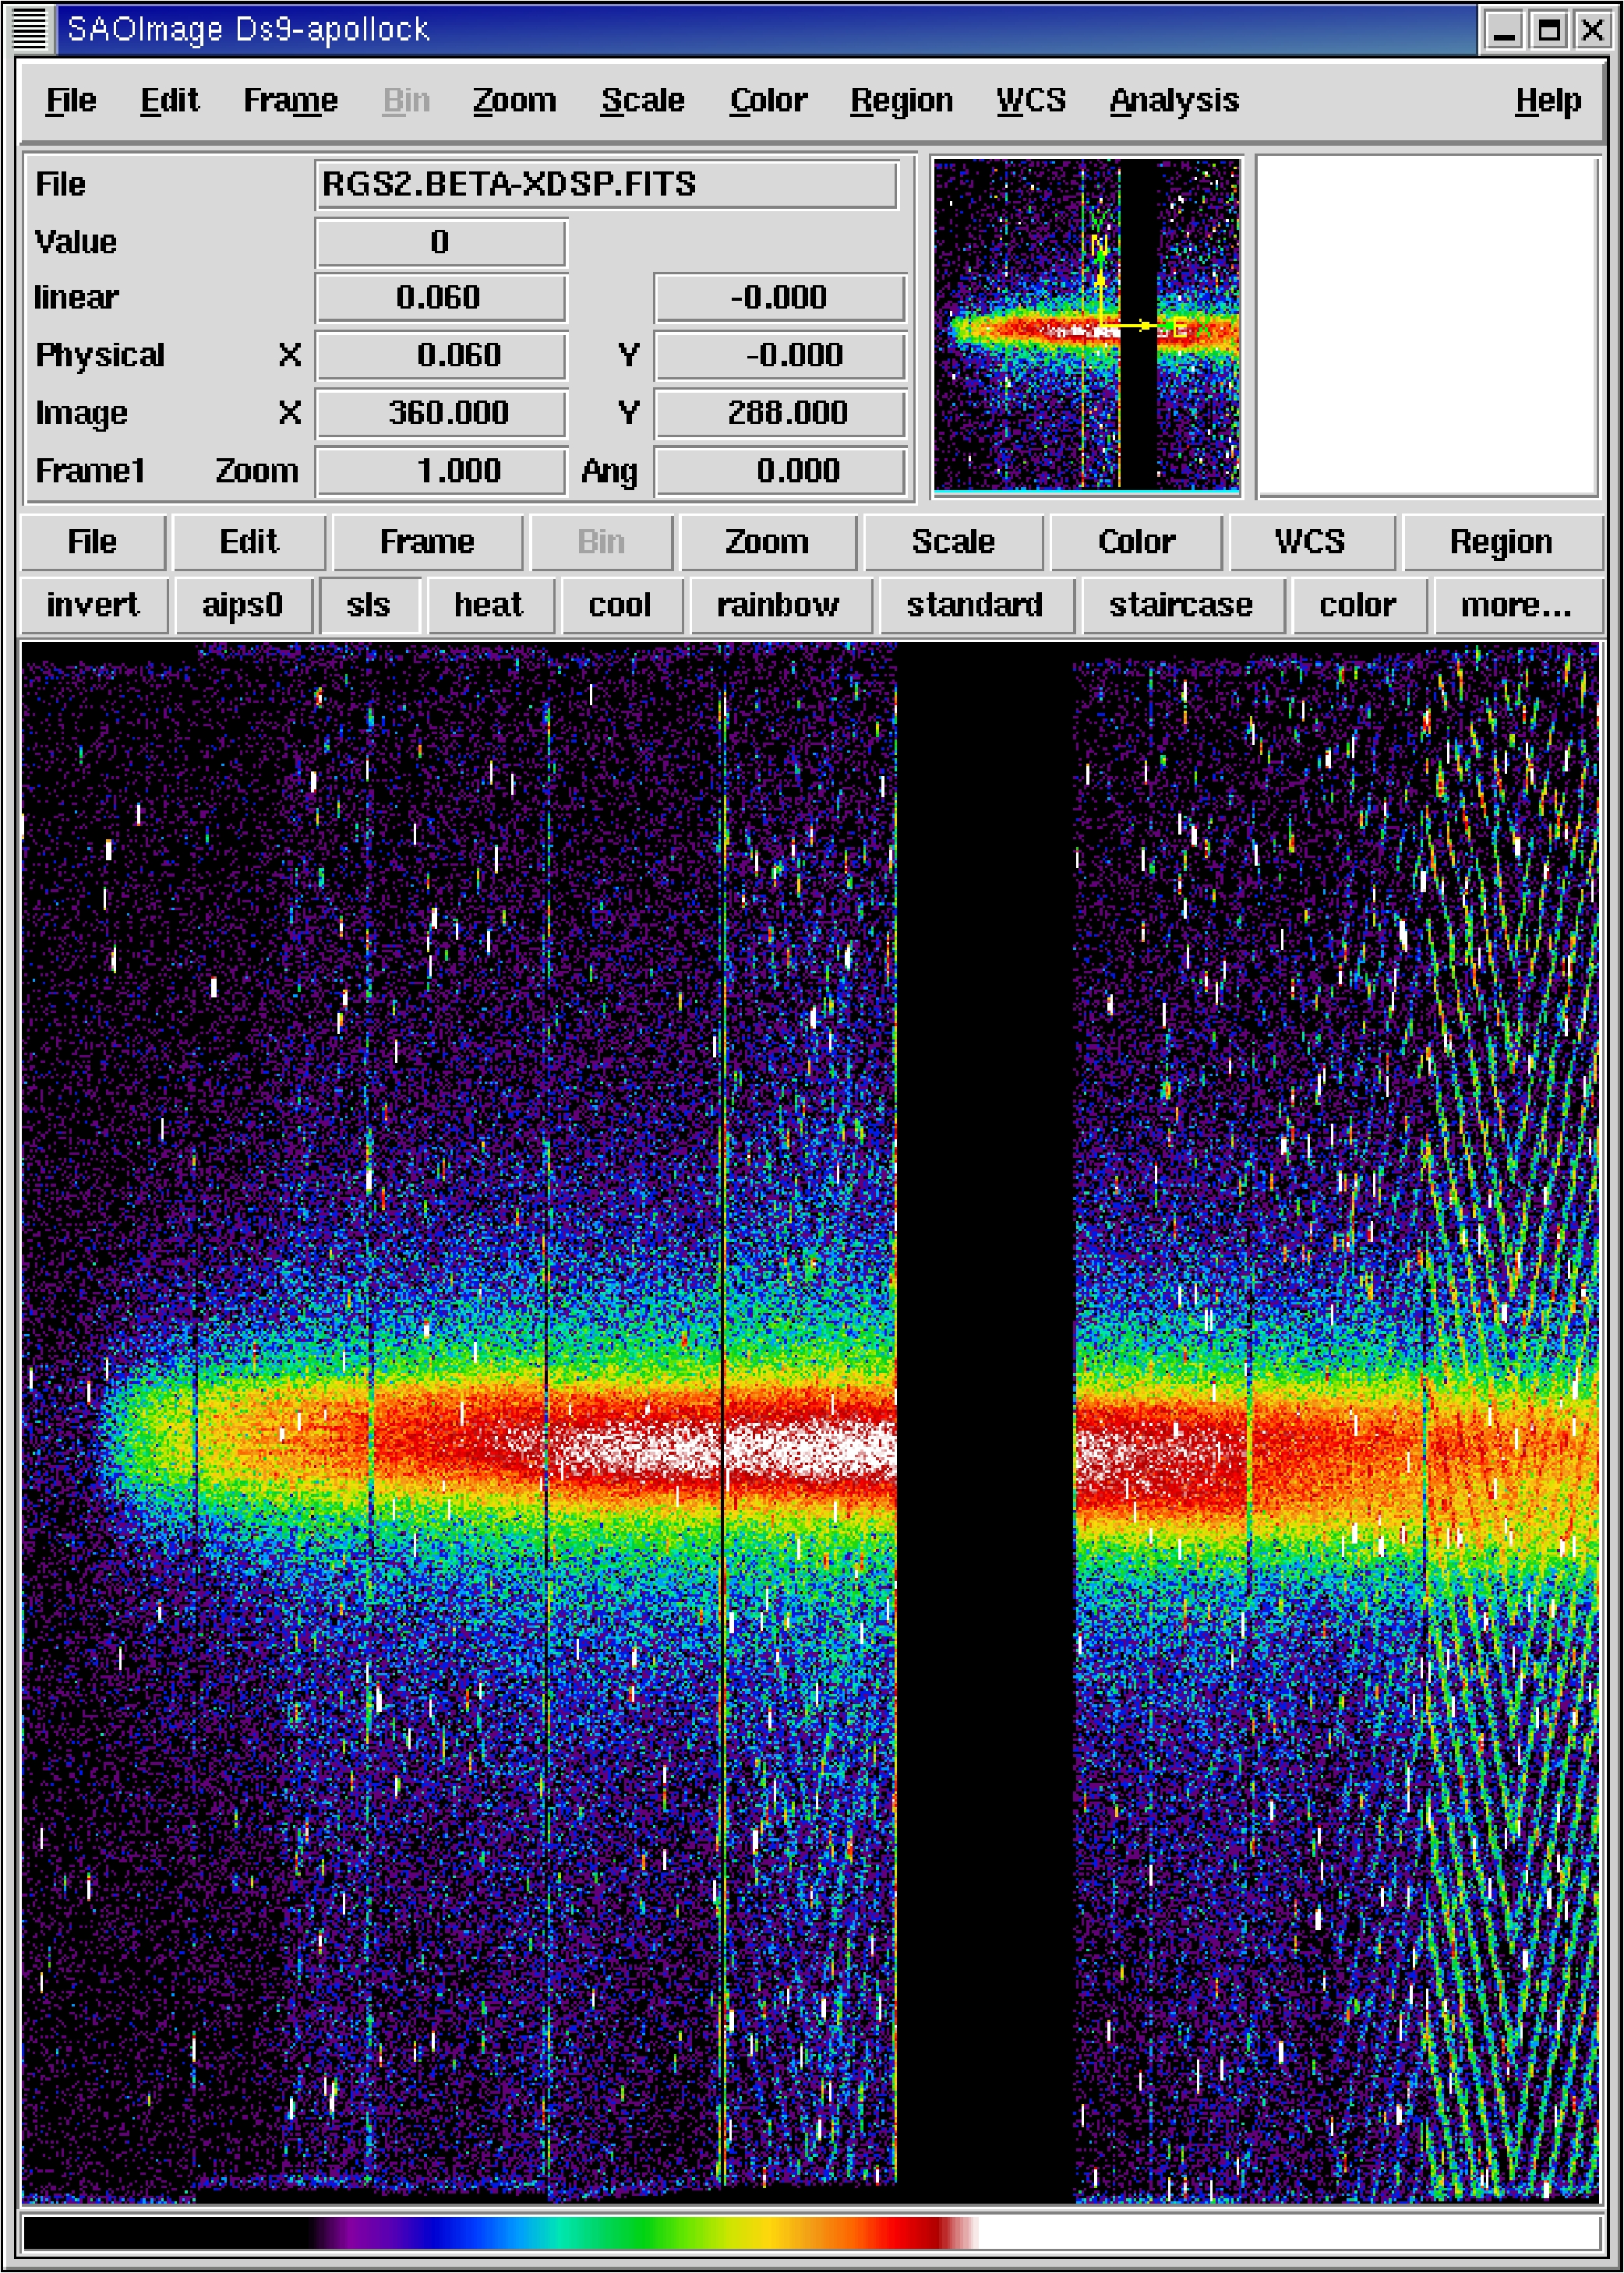
Fig. 41 shows plots of the merged RGS1 events. These plots are orthogonal projections of the all-important MLAMBDA,XDSP_CORR,PI 3-D RGS data space of the merged list of all the events detected in the observation, thus showing all the features of RGS data. The edges are clear of the 9 CCDs, numbered 1-9 from right to left. In both plots, wavelength and dispersion angle increase from left to right.
|
The pointing coordinates were evidently chosen well enough to put this
bright source central in the aperture. The source was bright enough to
be seen up to 4th or even a weak 5th order in the characteristic
hyperbolic-shaped areas occupied by photons that have passed through the
gratings. There are plenty of hot pixels and columns and the so-called
fixed pattern noise shows as the herring-bone pattern in CCDs 1 and
2. Calibration sources of F K![]() at PI
at PI![]() eV span CCDs
2&3 and 7&8 ; and Al K
eV span CCDs
2&3 and 7&8 ; and Al K![]() at PI
at PI![]() eV span CCDs 3&4
and 8&9.
eV span CCDs 3&4
and 8&9.
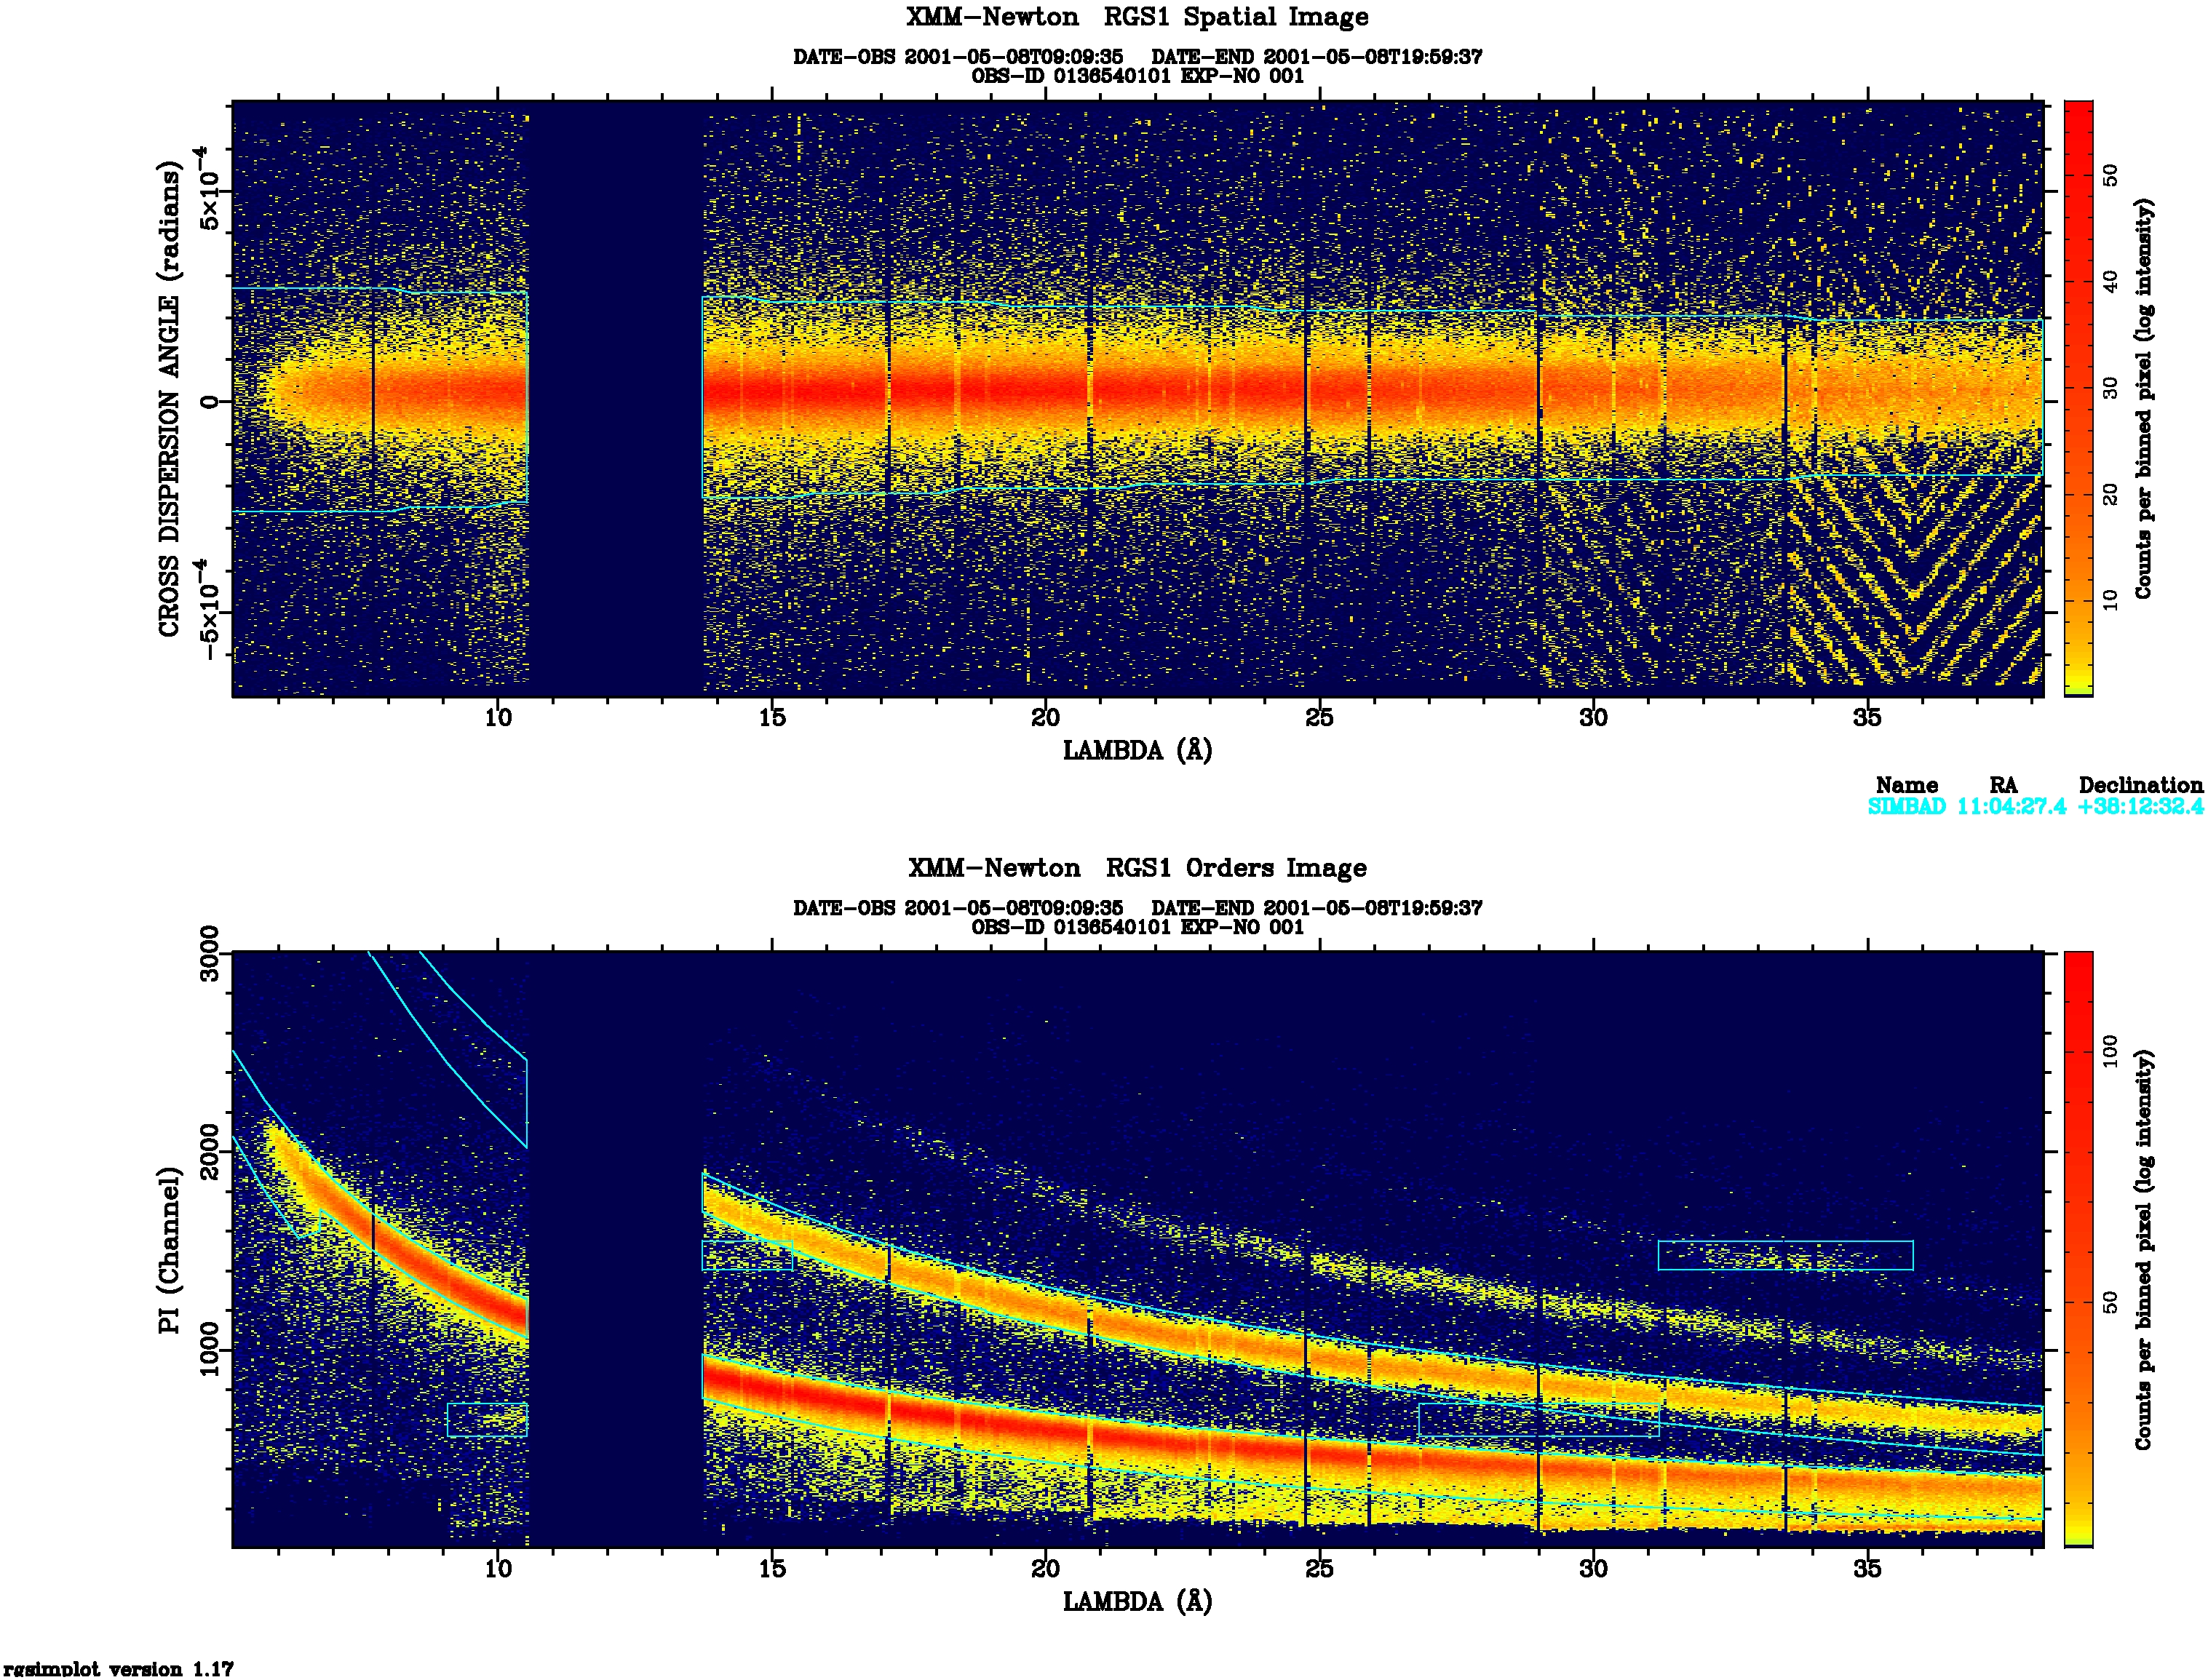
The locations of the selection regions may be checked using the task rgsimplot
http://xmm-tools.cosmos.esa.int/external/sas/current/doc/rgsimplot
which plots the regions over MLAMBDA-XDSP and MLAMBDA-PI images that are, in this case, most usefully generated from the screened events files. Fig. 42 shows such an example.
European Space Agency - XMM-Newton Science Operations Centre