Next: 3.3.7.3 EPIC Detector Noise Up: 3.3.7 EPIC background Previous: 3.3.7.1 EPIC external `flaring' background
This quiescent component is associated with high energy particles interacting
with the structure surrounding the detectors and the detectors themselves.
The intensity of the quiescent component is monitored regularly for both MOS
and PN cameras during CLOSED filter observations. The component shows only
small intensity variations in time which are typically observed on long
time-scales. The intensity of this component during any given observation
is within  10% of the mean. The intensity observed in one MOS camera is
usually well correlated with the intensity measured in the other, although
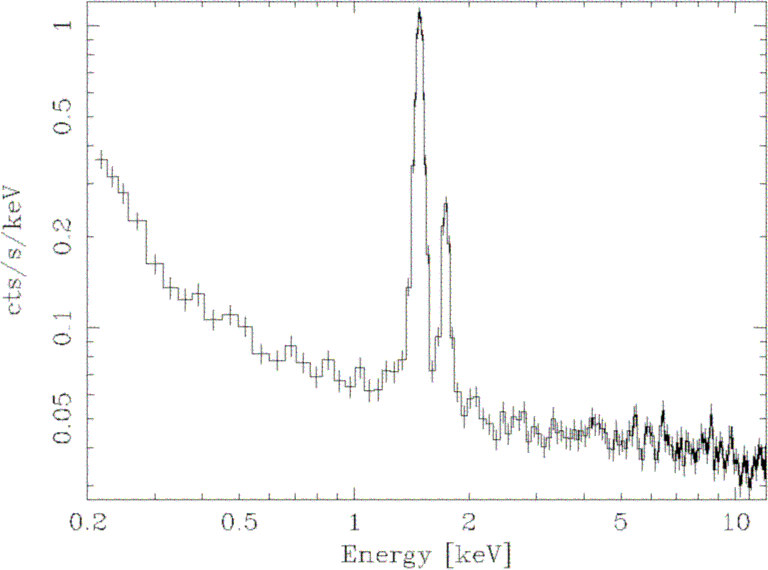
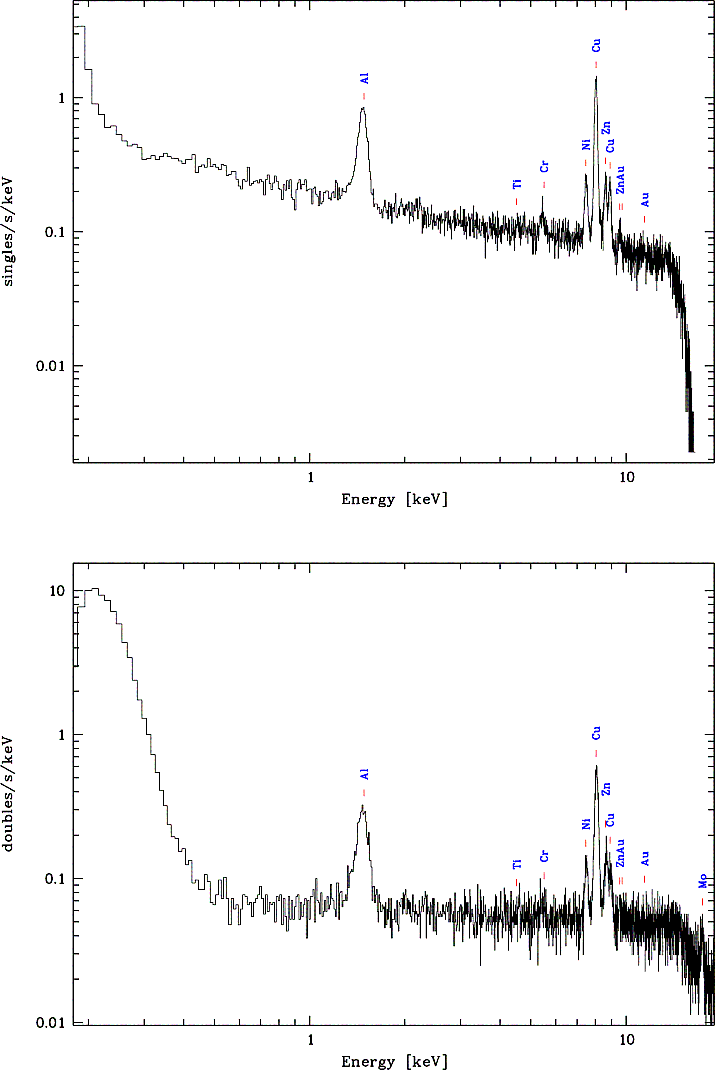
some exceptions have been observed. In Figs. 34 and
35 we show
the spectrum of the quiescent component for the MOS1 and PN camera, respectively.
 |
 |
The spectra are quite flat and present a number of spectral features due
to fluorescence from the detectors and the structure surrounding them.
Al-K and Si-K
 lines are clearly visible in the
MOS spectrum. In case of the PN Al-K
 and an intense complex
due to Cu-K
 , Ni-K
 and Z-K
 lines around 8 keV
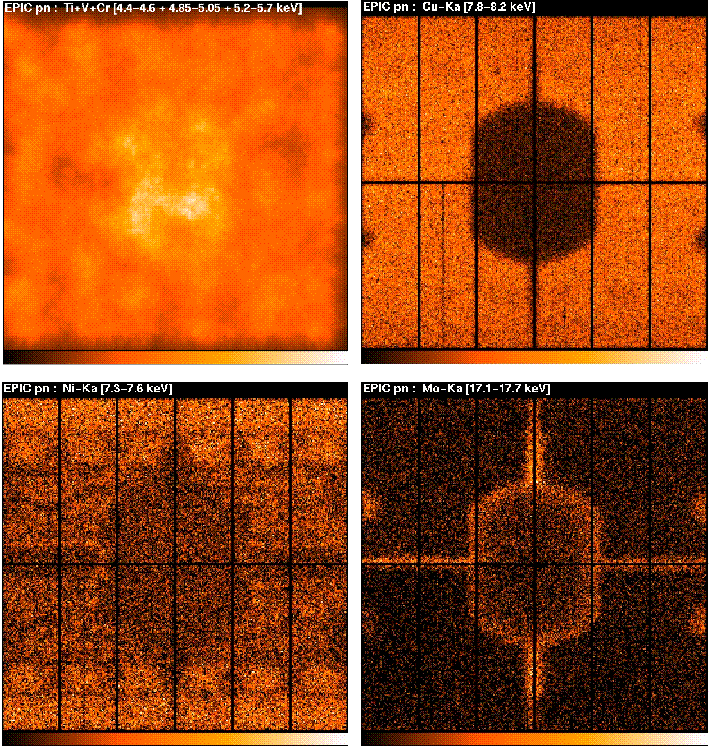
is visible. An important point is that the intensity of this complex is
not constant over the PN detector. More specifically there exists a
central circular region (see Fig. 36) where the
complex is virtually absent.
 |
Average count rates due to the internal "quiescent" background, for both MOS and
PN, in different modes and filters, as well as energy ranges and pattern
selection, can be found at:
http://www.cosmos.esa.int/web/xmm-newton/bs-countrate .
These count rates have been worked out using out-of-field events from Blank Sky event files.
European Space Agency - XMM-Newton Science Operations Centre