Next: 4.3 Points of concern Up: 4.2 Observing constraints Previous: 4.2.2 Celestial constraints
Target visibility should always be checked using the Target Visibility Checker available at URL http://www.cosmos.esa.int/web/xmm-newton/target-visibility-tool.
The Target Visibility Checker allows input of RA and Dec coordinates of a source and find the orbits and times when it is visible to XMM-Newton subject to viewing constraints. The constraints applied in the visibility analysis are actually used for satellite operation. More details on the use of this tool are provided on the Target Visibility Checker web page, especially in the “HowTo" section.
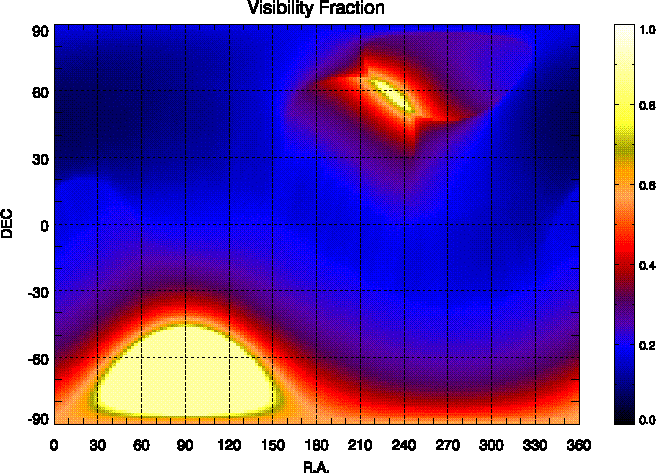
Fig. 121 displays a first-order approximation of the
sky visibility during the current AO. It is shown for illustrative purposes and can
be used as a rough guideline to assess whether any visibility problem
exists, but it is not intended to be used for quantitative statements.
An interactive tool based on this figure is available under the
link
http://www.cosmos.esa.int/web/xmm-newton/xmm-visibility.
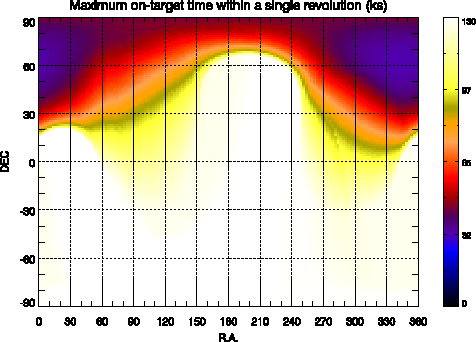
Fig. 122 shows sky areas for which a certain maximum continuous target visibility is reached within a single revolution in the current AO. Due to the evolution of the XMM-Newton orbit, this diagram is in fact changing with time; the visibility of some sky regions has become better along the XMM-Newton lifetime, while it is now significantly worse in some other regions. The same Fig. 122 has been generated for future AOs (Fig. 123), based on orbit evolution forecast. Absolute numbers on the visibility of a given region must be taken just as rough estimates, but the overall trend is correct: the poorer visibility occurs near the Earth location at spacecraft apogee and this position moves to higher declination and lower right ascension.
We recall that to obtain accurate visibility information for a given target coordinates, the Target Visibility Checker must be used.
European Space Agency - XMM-Newton Science Operations Centre