Next: 4.3.2.1 Improving the quality of EPIC-pn data: epreject Up: 4.3 Running the EPIC pipeline processing Previous: 4.3.1 Running the EPIC MOS processing meta-task
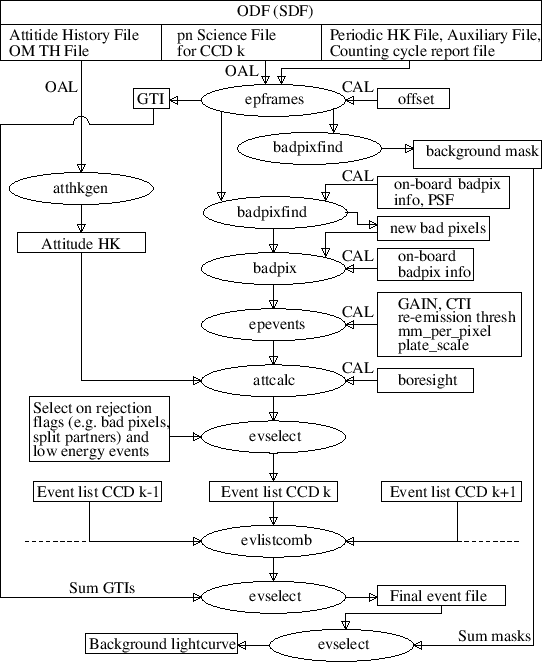
The EPIC pn meta task epproc concatenate all first-level pn tasks to produce calibrated event lists. The pn processing is sketched out in figure 12. The main subroutine (epframes, badpixfind, badpix, epevents and attcalc) creates one event list for a single exposure and for all selected CCDs from all the relevant ODF material and bad pixel lists calling in sequence:
Finally, making use of the task evlistcomb, the CCD
specific data sets are merged into a single event list. evselect
selects all those events arriving in good time intervals, applies (by
default) the destructive filter selection
(#XMMEA_EP) && (PI ![]() 150
150 ![]() PI
PI ![]() -150)
and writes the output file. For a description of the event attribute based
selection, refer to the documentation of the SAS package evatt.
-150)
and writes the output file. For a description of the event attribute based
selection, refer to the documentation of the SAS package evatt.
In the EPIC pn imaging mode, the EVENTS binary table of the calibrated event list file contains 14 columns i.e TIME, RAWX, RAWY, DETX, DETY, X, Y, PHA, PI, FLAG, PATTERN, PAT_ID, PAT_SEQ and CCDNR. For a description of the PAT* columns, refer to the documentation of the task epevents. The definition of the PATTERN values is also visualized in figure 17.
In the EPIC pn timing mode, the EVENTS binary table of the calibrated event list file contains only 9 columns: the spatial coordinates DETX, DETY, X, Y are not present as (in this mode) only one axis (RAWX) contains spatial information whereas the other axis is a measure of the arrival time of the event.