Next: 4.10 Detecting EPIC X-ray sources Up: 4.9 EPIC-pn Out-of-time events Previous: 4.9.1 Removing Out-of-Time events from pn images
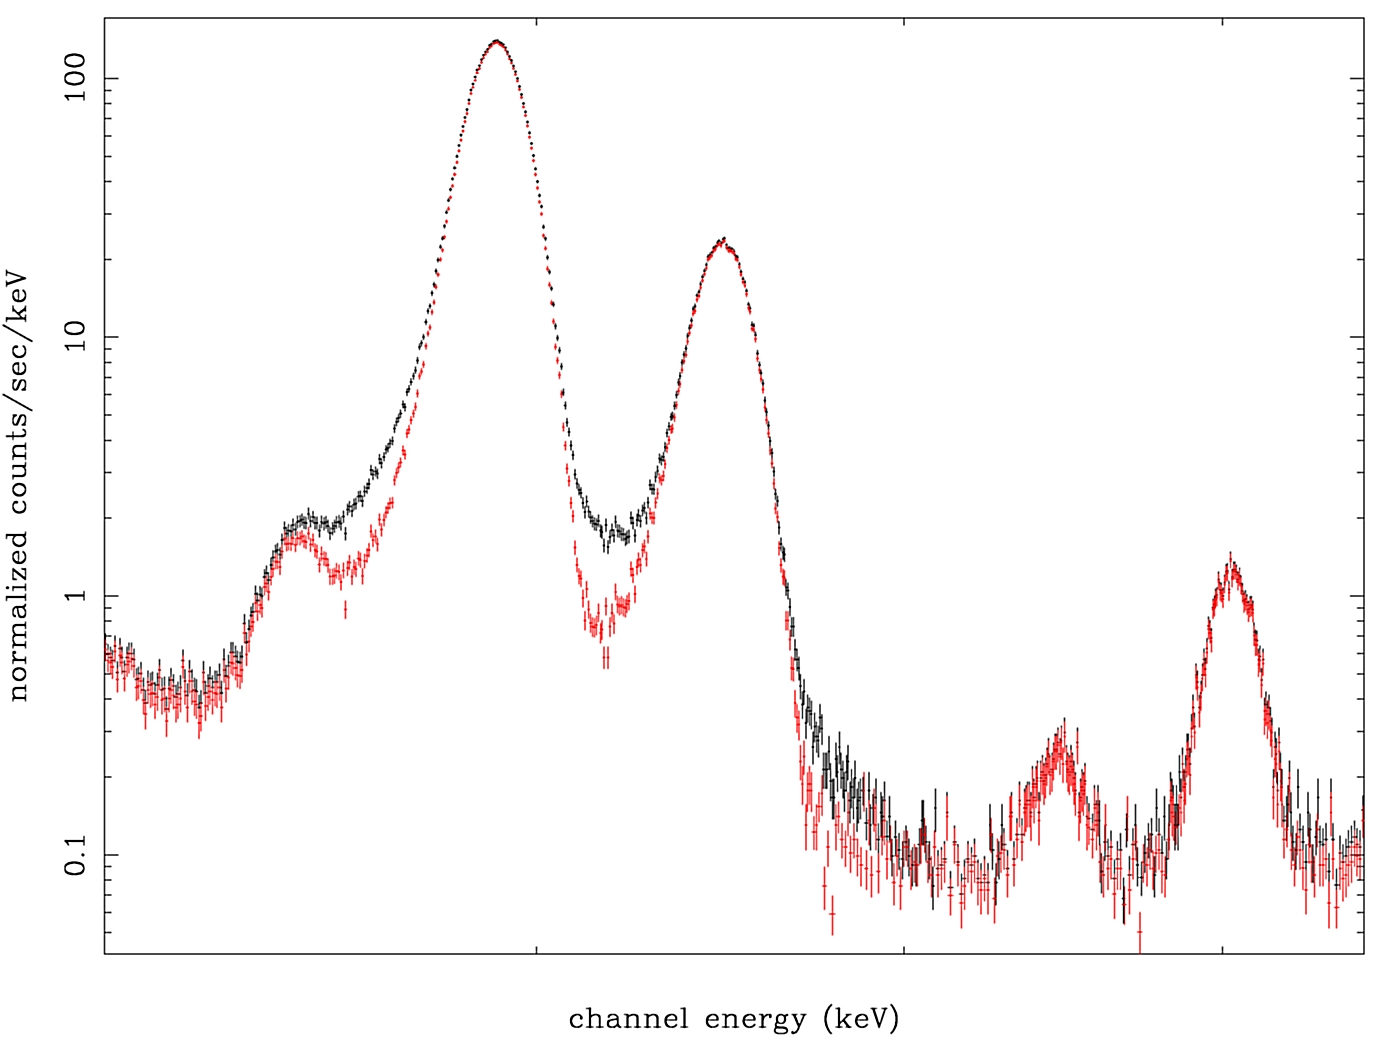
The handling of Out-of-Time events in spectra relies on dealing with FITS tables. As in the case of image cleaning of OoT events (see § 4.9.1), the necessary table manipulation and arithmetics can be performed with FTOOL tasks. Again, details of the procedure on how to correct a given spectrum from OoT events are given in the correspondent pages of the SAS Analysis Threads. As an example, the result of correcting for OoT events a given spectrum is shown in figure 30.
 |
The effect of OoT events is reduced to the broadening of the shoulders of a line and can cause a blending of lines. OoT events do not change the Full-width-at-half-maximum. The red spectrum shows that the lines in a spectrum cleared from OoT events are much easier to separate than in an untreated spectrum (black data points). Please keep in mind that the spectrum is displayed in a double logarithmic scale and restricted to a small energy band so as to emphasize the effect. Furthermore, the example shown here is data from the internal calibration source, which is very bright. For most targets a correction for OoT events in a spectrum should not be necessary. In any case, a correction is only necessary if OoT events overlap with the source under investigation.
European Space Agency - XMM-Newton Science Operations Centre