Next: 3.3.9 EPIC photon pile-up Up: 3.3 EUROPEAN PHOTON IMAGING CAMERA (EPIC) Previous: 3.3.7.4 EPIC background and its importance for extended sources
The EPIC sensitivity limits depend on the sky area, i.e. the true X-ray background and on the `space weather' as described in §§ 3.3.7.1 and 3.3.7.2.
As the sensitivity limits also depend on the angular structure and the spectral characteristics of the source that is observed, it is strongly recommended to use simulations to get an estimate of the signal to noise which can be achieved with a certain instrument setup and exposure time.
Currently the best statistical results on the EPIC sensitivity limits
are based on the Lockman Hole data (Hasinger et al., 2001, A&A 365, L45; Brunner et al. 2008, A&A, 479, 283).
In Table 4 the sensitivity limits in the “soft”,
“hard”, and “very hard” energy band are reported
| Band | Lockman Hole |
| “Soft” (0.5-2 keV) | 0.19 |
| “Hard” (2-10 keV) | 0.9 |
| “Very hard” (5-10 keV) | 1.8 |
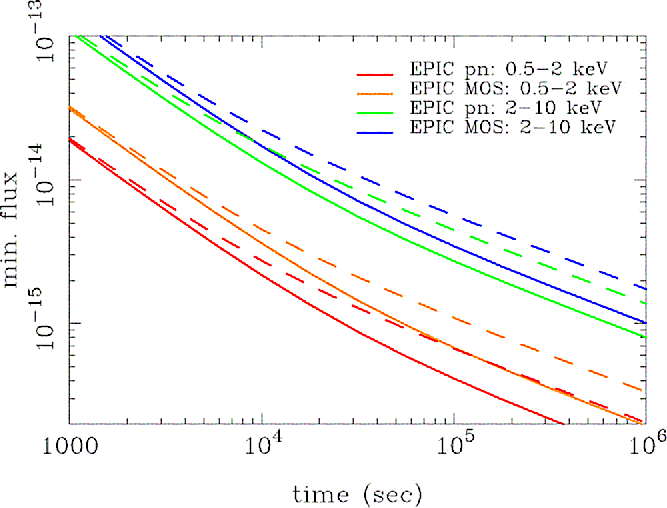
Watson et al., 2001, A&A, 365, L51 used the nominal quiescent background values
together with the measured XMM-Newton PSF to compute an EPIC point source
sensitivity based on a simple 5 source detection criterion against
assumed purely Poissonian background fluctuations, as shown in
Fig. 373. These estimates are in
reasonable agreement with the flux distribution of sources in the EPIC
Serendipitous Source Catalogue (Watson et al., 2009, A&A, 493, 339).
source detection criterion against
assumed purely Poissonian background fluctuations, as shown in
Fig. 373. These estimates are in
reasonable agreement with the flux distribution of sources in the EPIC
Serendipitous Source Catalogue (Watson et al., 2009, A&A, 493, 339).
 |
The actual background in an observation depends critically on the fraction of background flares removed, i.e. the trade off between net background levels and net exposure time.
At very faint fluxes the effective sensitivity is potentially limited by confusion effects. However, recent estimates indicate that the confusion limit in the hard X-ray band (2-10 keV) is only reached after 2 Ms of observing time and will probably never be reachable in the 5-10 keV band.
European Space Agency - XMM-Newton Science Operations Centre


