Next: 3.5.4 Optical/UV point spread function of the OM and tracking Up: 3.5.3 OM optical elements Previous: 3.5.3.1 OM filter band passes
In addition to the filters, the OM filter wheel holds two grisms. The throughput of the OM grisms depends on wavelength. The Inverse Sensitivity Function (ISF) gives the transformation from count rate in any extracted spectrum to physical flux units as a function of wavelength.
The ISFs for both OM grisms are displayed in Fig. 103.
Only one grism can be used at any time, because they are mounted together with the other optical elements (see Table 16) on the OM filter wheel.
The angular dispersion of the grisms is almost constant over their
wavelength ranges. The UV grism has a dispersion of ca.
0.25 nm per pixel (unbinned), the optical one has a dispersion of 0.5 nm per pixel.
The grisms can thus be used for low resolution (resolving power  180)
optical and UV spectroscopy in conjunction with the X-ray observations.
As an example of both grisms flight performances,
the flux calibrated spectrum of the white dwarf HZ 2 is
shown in Fig. 104. It is compared with the standard flux of this
star provided by the HST Calspec database. The flux converted count rates of
the star measured with the OM lenticular filters are also shown. An image of the target area taken prior to or after obtaining spectroscopic
exposures with a grism can be useful for identification of the spectral
sources.
180)
optical and UV spectroscopy in conjunction with the X-ray observations.
As an example of both grisms flight performances,
the flux calibrated spectrum of the white dwarf HZ 2 is
shown in Fig. 104. It is compared with the standard flux of this
star provided by the HST Calspec database. The flux converted count rates of
the star measured with the OM lenticular filters are also shown. An image of the target area taken prior to or after obtaining spectroscopic
exposures with a grism can be useful for identification of the spectral
sources.
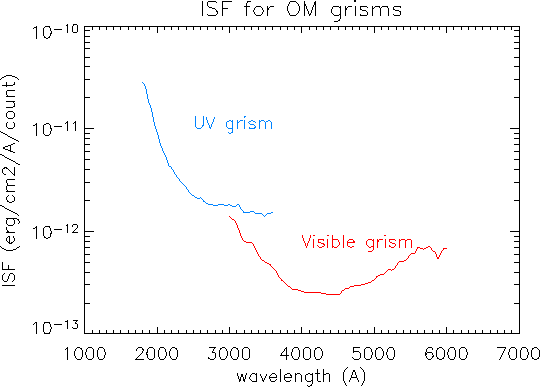 |
The optical grism is blazed and the zeroth order image is relatively weak. The UV grism is not blazed, however, and ca. 1/3 of the light is expected to go into the zeroth order image, which is expected to be visible near the edge of the FOV when the first order spectrum is centred. Since the UV grism is not blazed, the overlap of the second order on the first one becomes very important above 360 nm, thus limiting the spectral range displayed in Fig. 103.
Approximate sensitivity of the grisms in terms of limiting flux that can be reached in typical exposure times is given in Table 18. Flux values in the table refer to the UV grism. The limit for the visible grism is ten times fainter.
| Detection | Exposure time (s) | |
| level | 1000 | 5000 |
1- |
1.0  |
4.6  |
| 3- |
4.0 |
1.6 |
| 10- |
2.4 |
7.0 |
It should be noted that because the grisms produce spectra of all objects in the field of view, there may be overlapping of zero and first orders corresponding to other objects that can contaminate the spectrum of the main target. This can be avoided in many cases by properly selecting the observing position angle. The interactive tool in URL:
http://www.mssl.ucl.ac.uk/www_astro/xmm/om/om_wintool/om_tool2.html
may be helpful to do that.
As with the narrow-band filters, discussed in Sect. 3.5.3.1, data taken with the grisms suffer from a time-dependent decline in the OM throughput. The decline in each grism is currently characterised in the OM_GRISMCAL_0008.CCF, see XMM-CCF-REL-413 and references therein and, at 2025.0, the throughput in the UV and Visible grisms were 86% and 89%, respectively. In addition, since the observation of Jupiter in revolution 3224 (July 2017), grism data taken in the default observation configuration fall cross the patch of diminished sensitivity caused by that event. The UV grism is affected between 2120-2160 Å, with maximum depth near 2350 Å, while the Visible grism is affected between 3440-4180 Å, being deepest around 3860 Å, with a maximum depth of about 25% in both cases. The suppression of throughput is significantly dependent on exactly where the spectrum crosses the major axis of the elliptical patch.
European Space Agency - XMM-Newton Science Operations Centre


