pn Filter Wheel Closed Data
Extended Full Frame (eFF) mode
This page provides links to several events files: On the one hand, a link to the merged events file containing the sum of all the EPIC-pn
Filter Wheel Closed observations available in the XMM-Newton archive up to a given date; on the other, links to the individual events files
that make up the merged events file. A given user may want to use only a specific selection of events to produce tailor made Filter Wheel Closed data.
This can be done in either of two ways: by filtering the merged events file and,
by combining individual events files.
How to Filter the Merged Event List
Any column in the merged events list can be used for filtering. Columns containing
the revolution number (Rev), the observation id (Obsid) and the exposure id (Expid) corresponding to each event have been added to the merged events list.
This makes filtering the merged events list for given periods of time easier. For example, if only a particular subset of revolutions
of the merged filter wheel closed events list is wanted, the SAS task
evselect can be used in the following way:
- If only data from a given revolution range wants to be used:
evselect table=pn_closed_EFF_2022_v2.fits expression="(Rev>=780 && Rev<=970)" withfilteredset=yes filteredset=filtered.fits
- If a given revolution wants to be excluded:
evselect table=pn_closed_EFF_2022_v2.fits expression="(Rev!=780)" withfilteredset=yes filteredset=filtered.fits
- Nevertheless, if filtering based on TIME is required, the following expression will select only a given time period:
evselect table=pn_closed_EFF_2022_v2.fits expression="TIME>=2.1803e+08 && TIME<=2.4070e+08" withfilteredset=yes filteredset=filtered.fits
The TIME is expressed in terms of number of seconds since the reference time (1998-01-01T00:00:00)
In each case, the file filtered.fits will contain only those events that fulfill the expression.
Information on
how to write or combine filter expressions can be found in the documentation of
selectlib.
Warning: Filtering the merged events list requires a large amount of memory usage. Users experiencing OutOfMemory problems
may want to choose the low-memory-model within SAS (set the SAS environment variable SAS_MEMORY_MODEL to low; see the
SAS documentation for more details).
How to Merge Individual Events List
Several individual Filter Wheel Closed events lists can be merged using the
SAS task merge. For example, to merge data corresponding to two given revolutions,
the merge command would look like this:
merge set1=file_1 set2=file_2 outset=merged_1.fits mergedifferentobs="yes"
The file merged_1.fits will contain the merge events lists corresponding to the two revolutions.
More revolutions can be added simply be merging the corresponding revolution file and the file merged_1.fits. For instance:
merge set1=file_3 set2=merged_1.fits outset=merged_2.fits mergedifferentobs="yes"
The file merged_2.fits will contain events corresponding to file_1, file_2 and file_3.
Information on additional functionality when merging events files can be found in the documentation of the SAS
task merge.
Merged Event List: Merged Filter Wheel Closed events lists.
The individual events files have been filtered for periods of background flaring.
Columns containing the revolution number (Rev), the observation id (Obsid) and the exposure id (Expid) corresponding to each event have been added to the merged events list.
A column Weight has been added to the events lists that contains, for each event, the inverse effective area over one exposure.
The SAS task evigweight has been used to compute these weights.
The individual events lists that make up the merged file are listed below.
The Merged OoT (Out-of-Time) Events File has been produced with the same characteristics as the Merged Events File but contains instead OoT
events simulated based on the original event list. See the SAS Manual
for a description of the OoT effect and its correction.
No individual OoT events files are provided, but they can be extracted if needed following the filtering procedures given above.
File Size[Mb]: Size of the Merged Filter Wheel Closed events list in units of megabyte.
Total Time[ks]: Duration of the merged Filter Wheel Closed exposures in units of kilosecond.
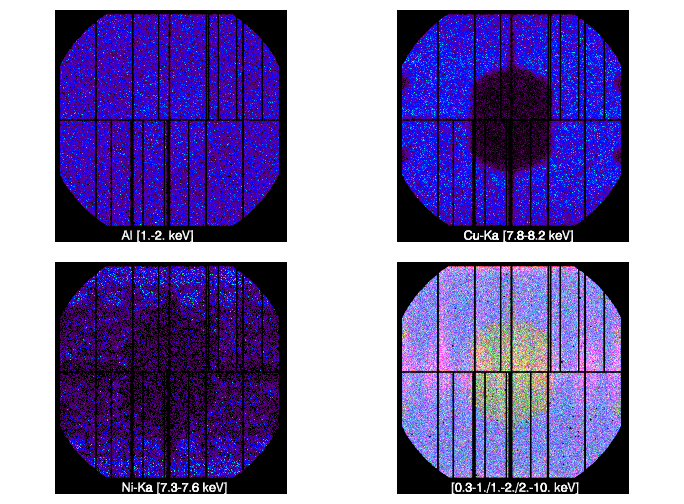
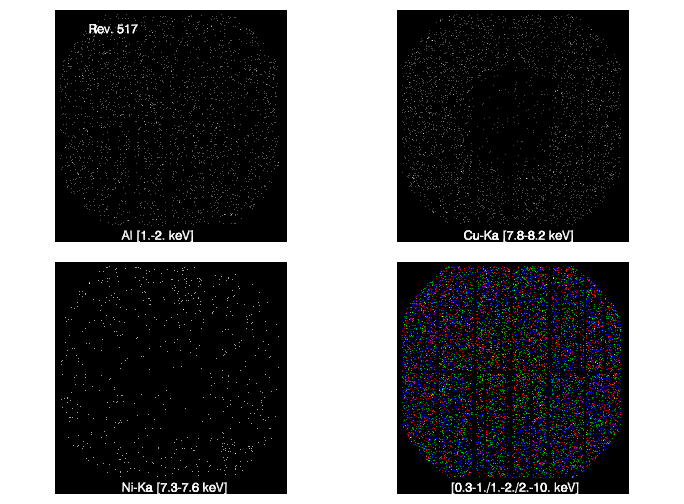
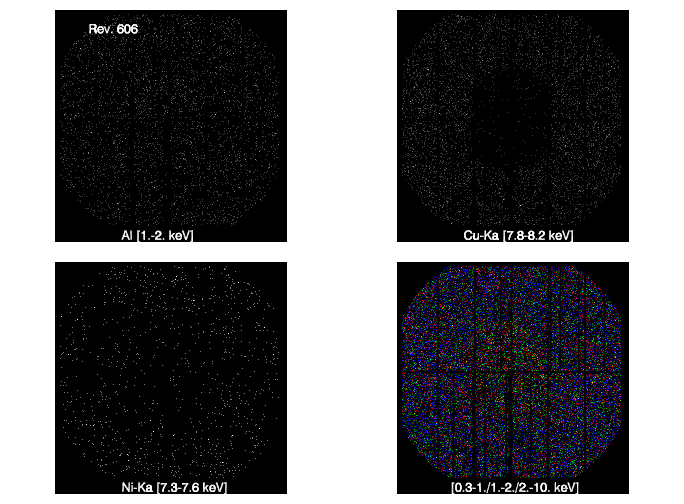
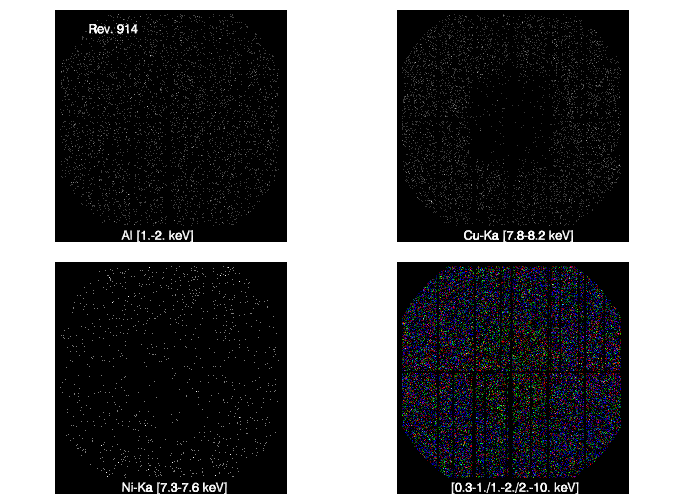
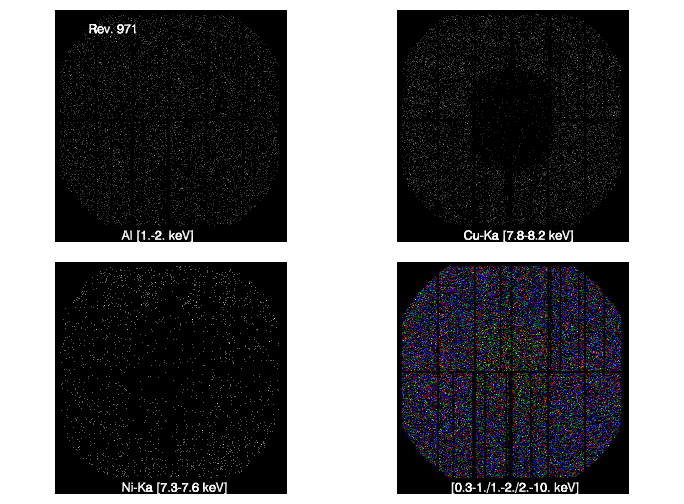
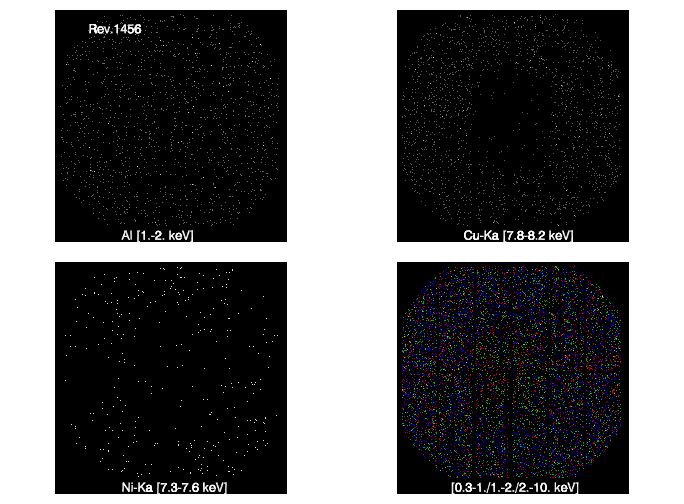
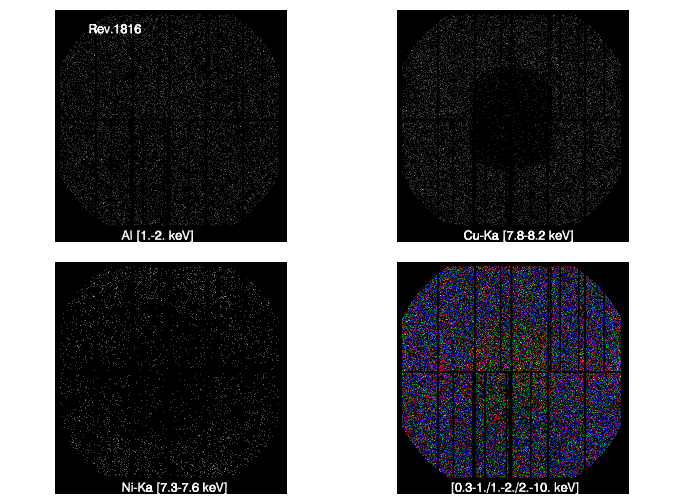
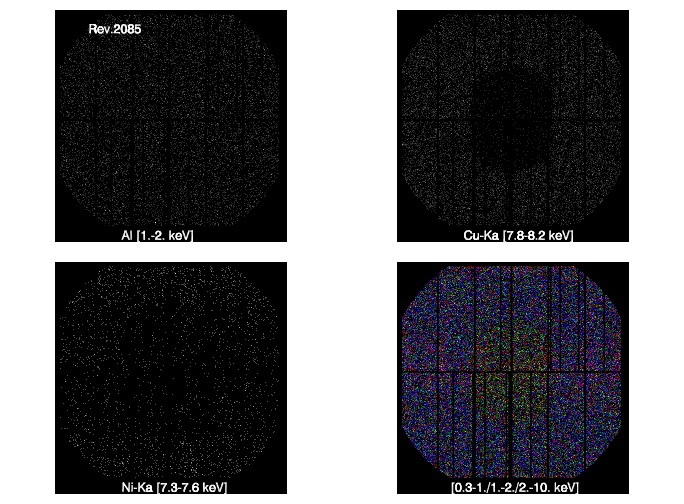
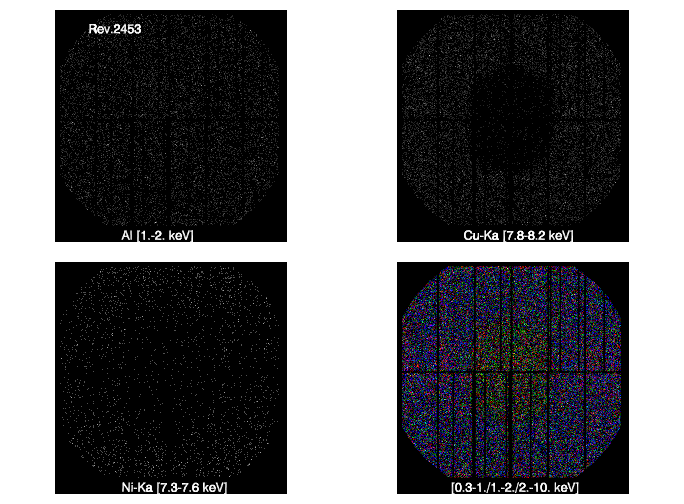
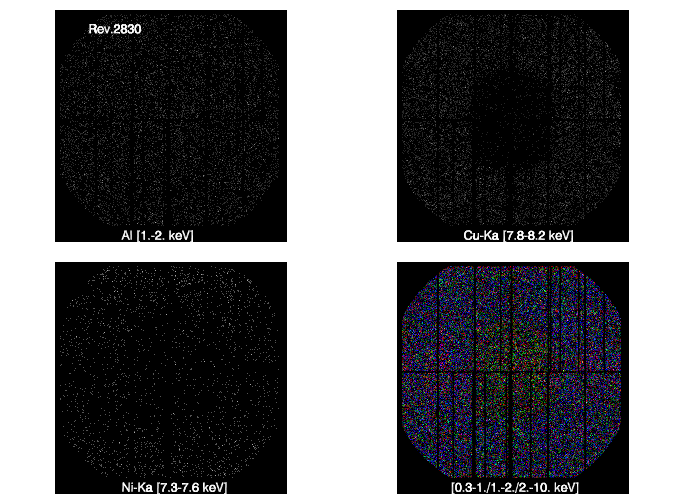
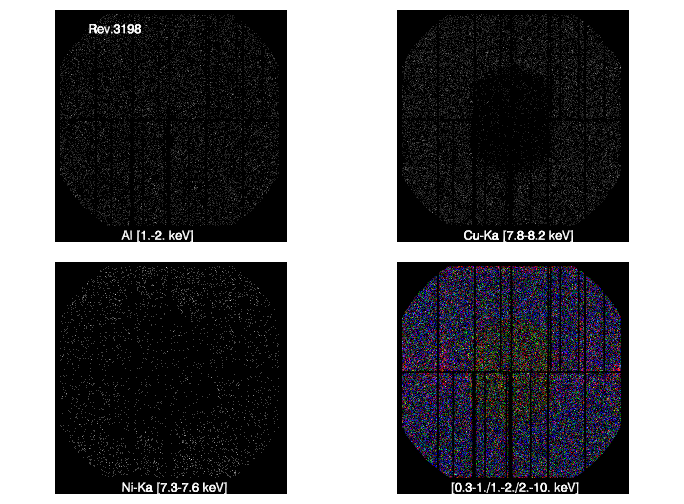
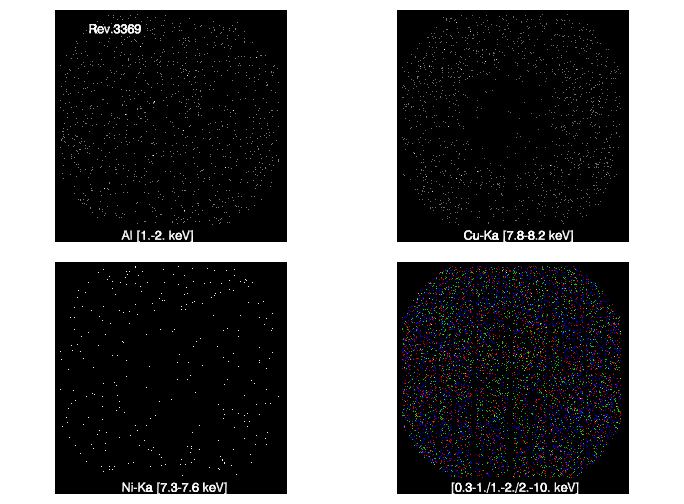
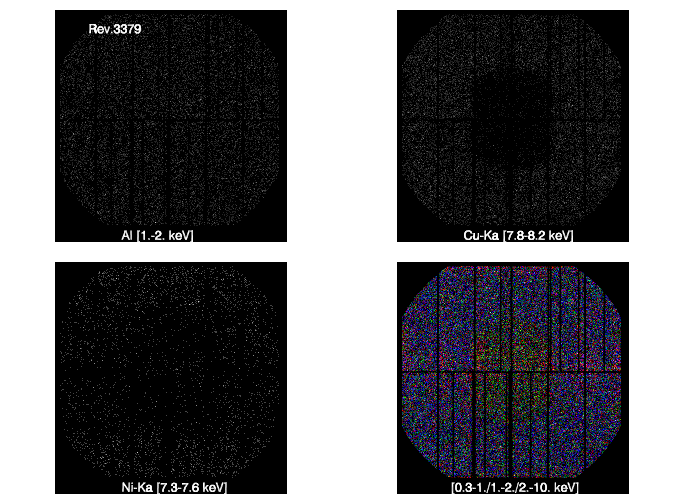
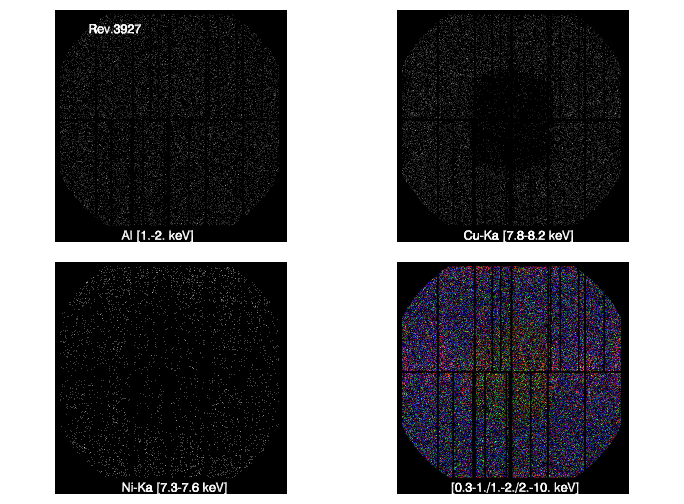
Image: Combined Filter Wheel Closed filtered image in (DETX, DETY). The filter expression used to create these images is (FLAG==0 && PATTERN <= 4).
Four images are shown corresponding to different energy ranges:
Top Left, energy range 1-2 keV; Top Right, energy range 7.8-8.2 keV; Bottom Left, energy range 7.3-7.6 keV; Bottom Right, false color image (0.3-10. keV).
These energy ranges have been chosen to highlight known instrumental spectral features (see the EPIC background section of the
XMM-Newton User Handbook for more details).
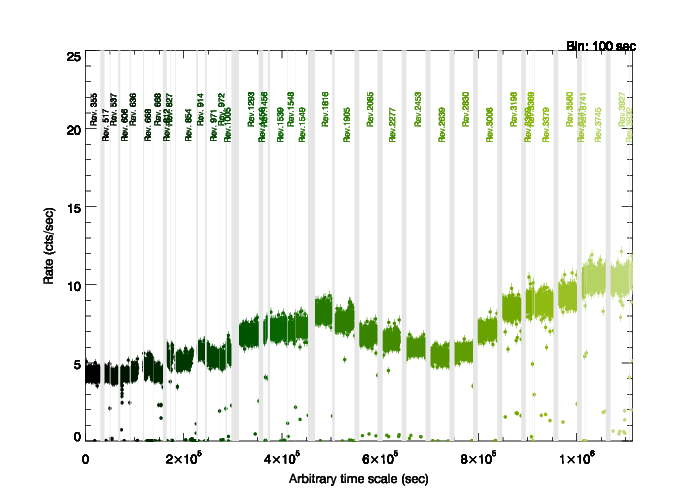
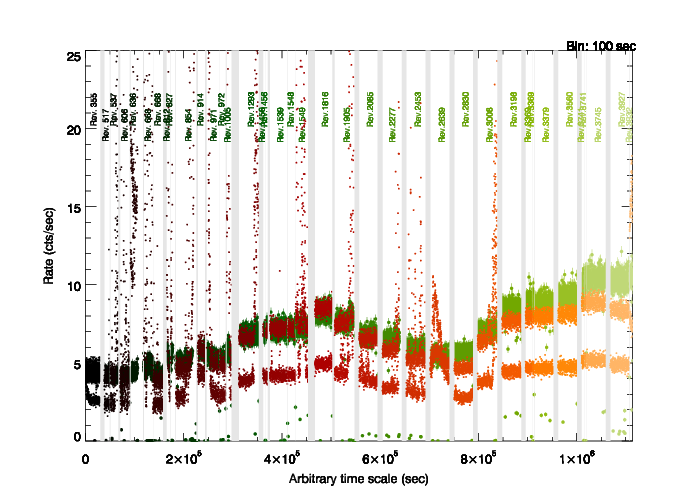
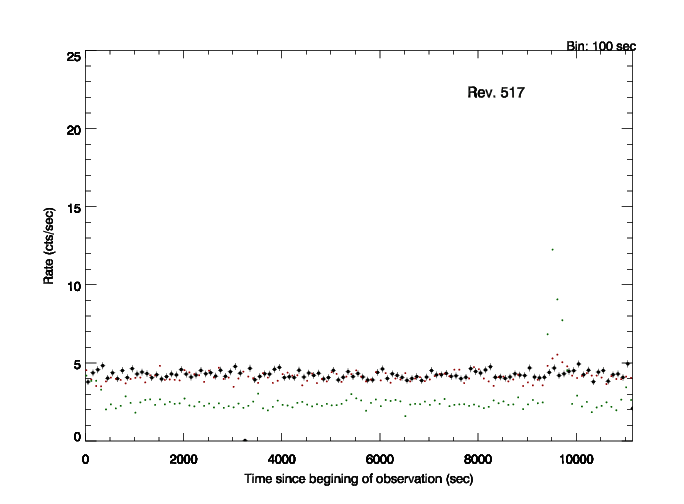
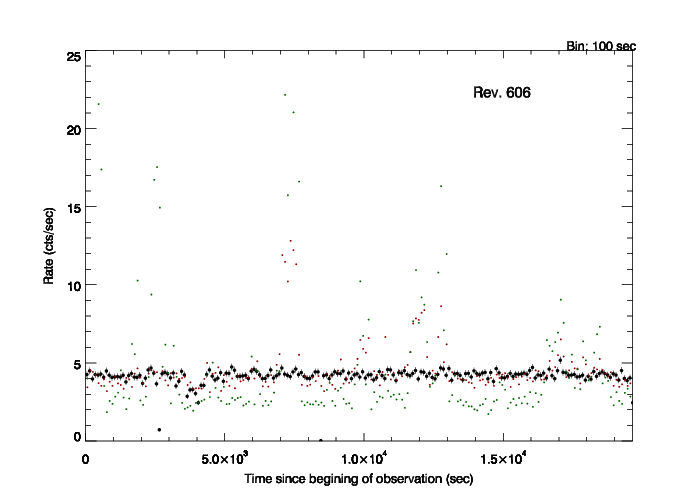
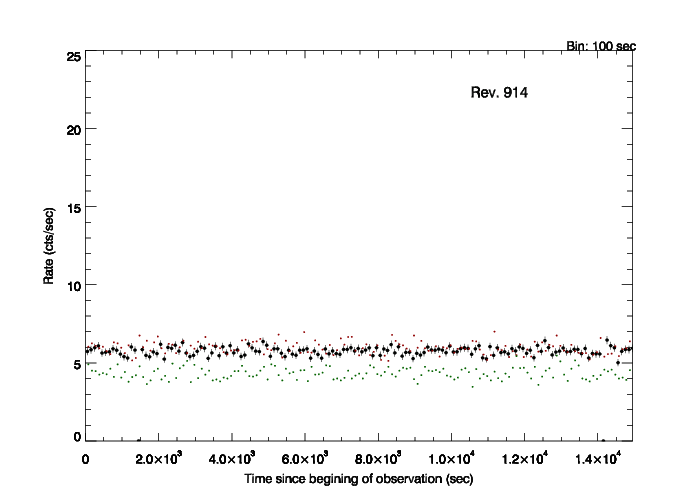
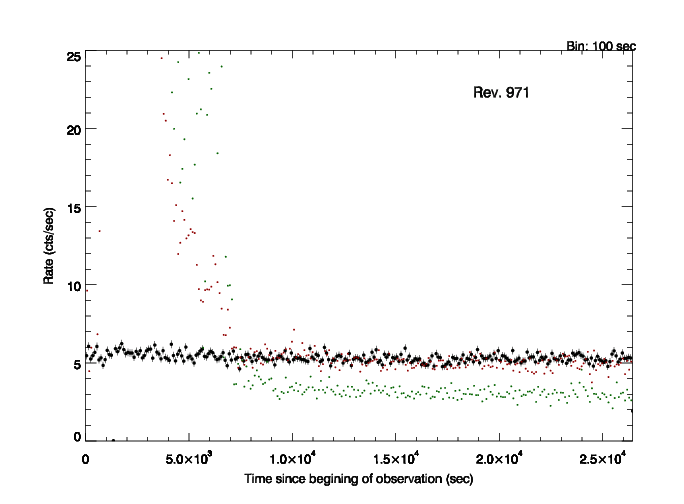
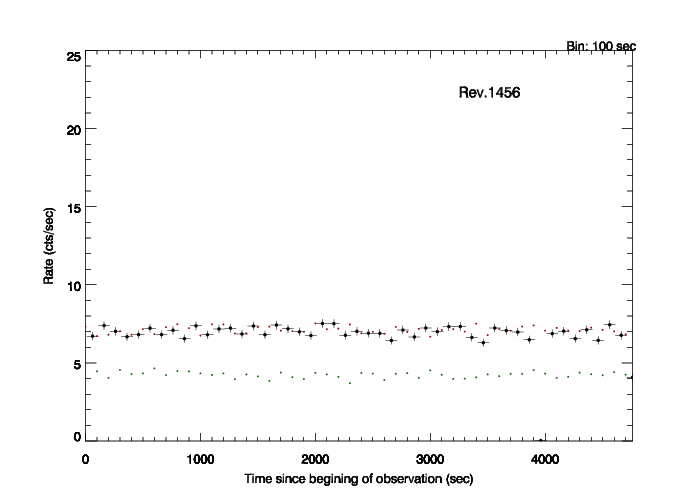
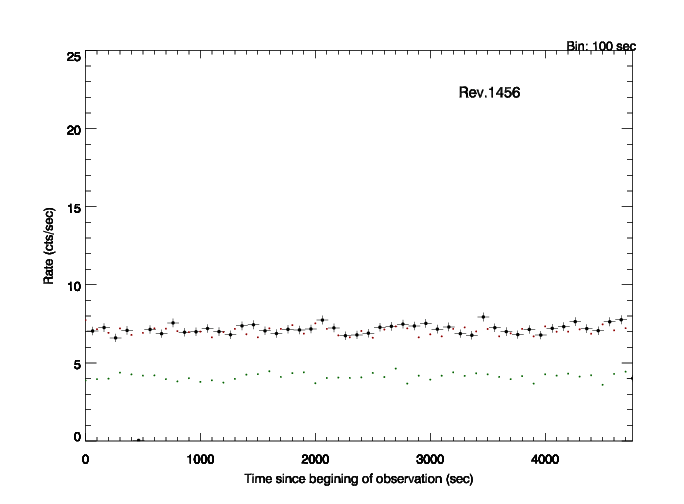
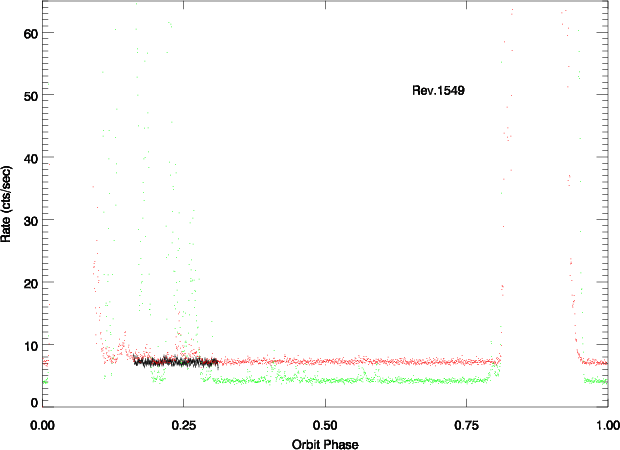
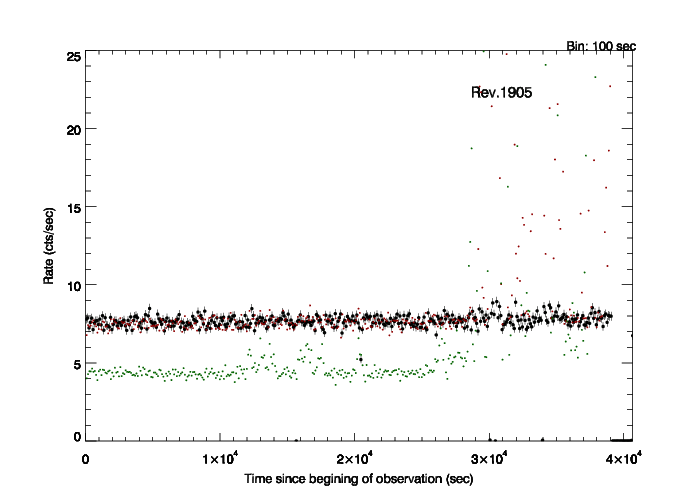
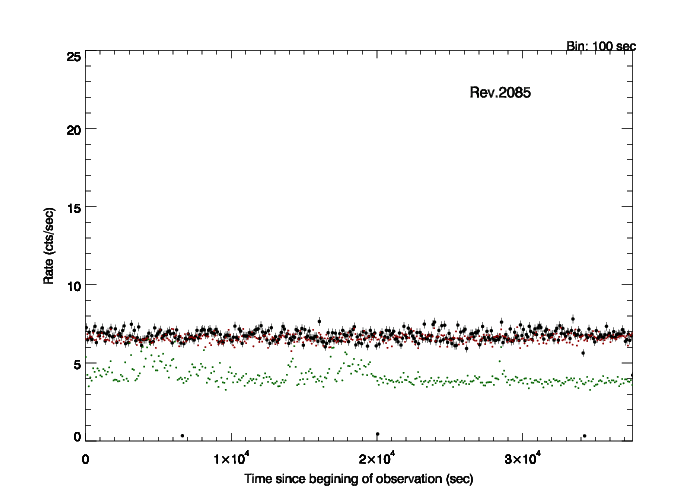
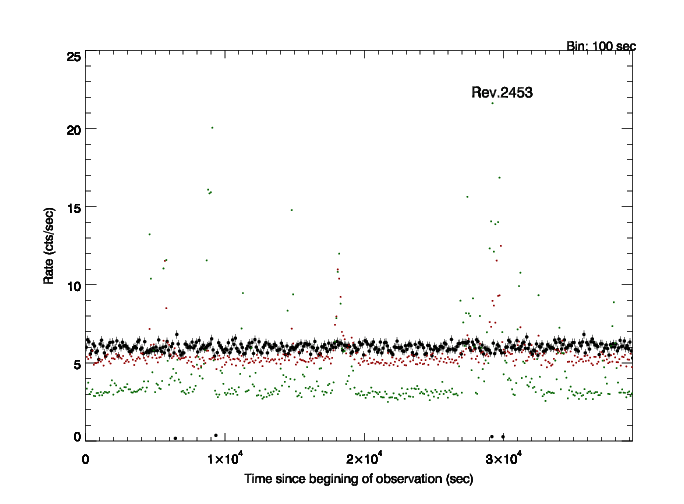
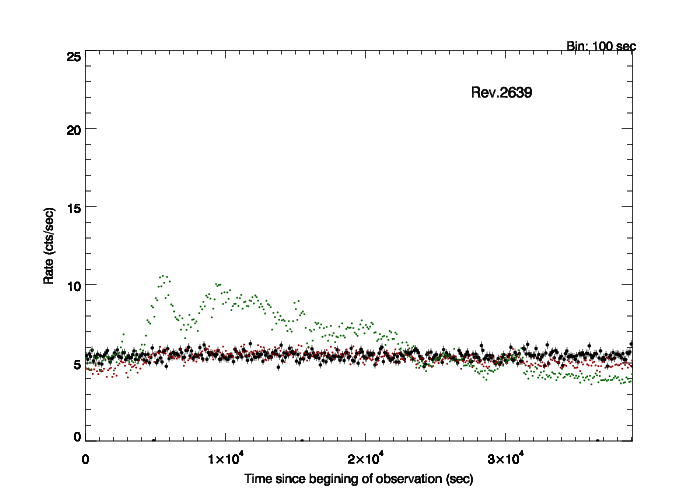
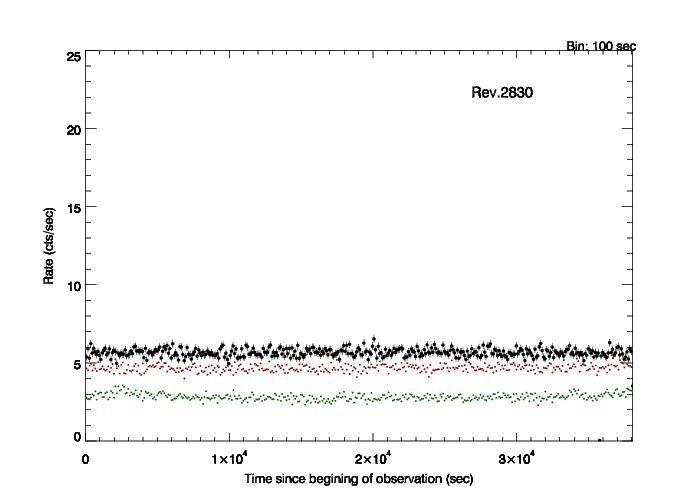
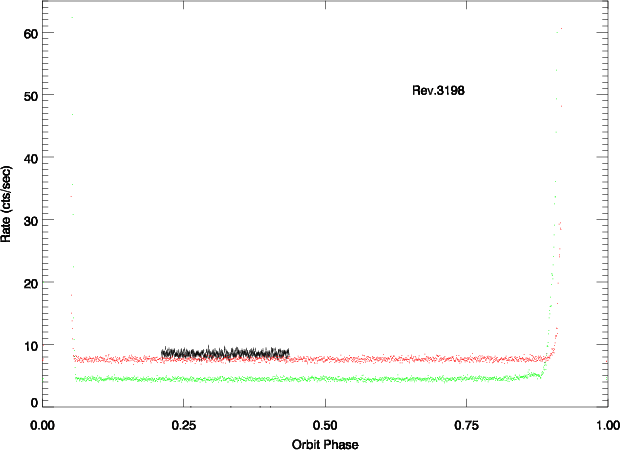
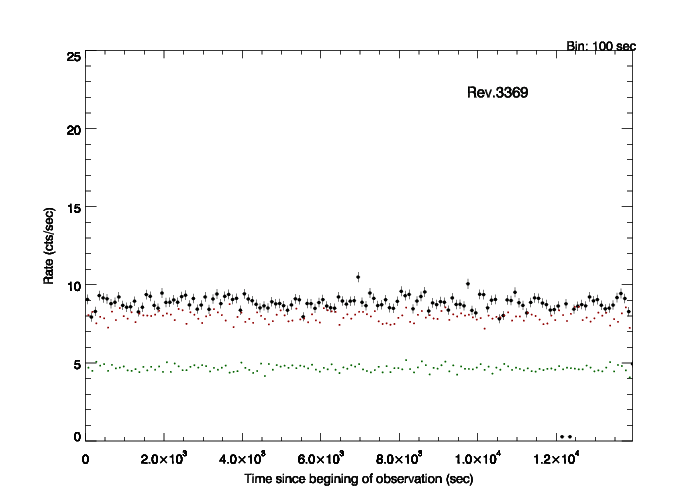
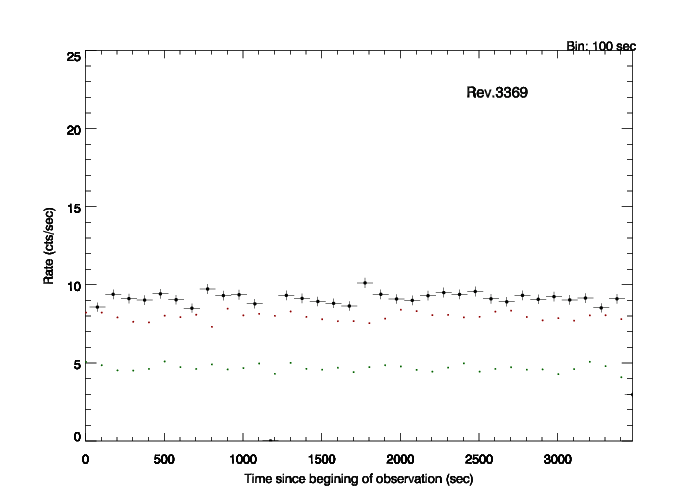
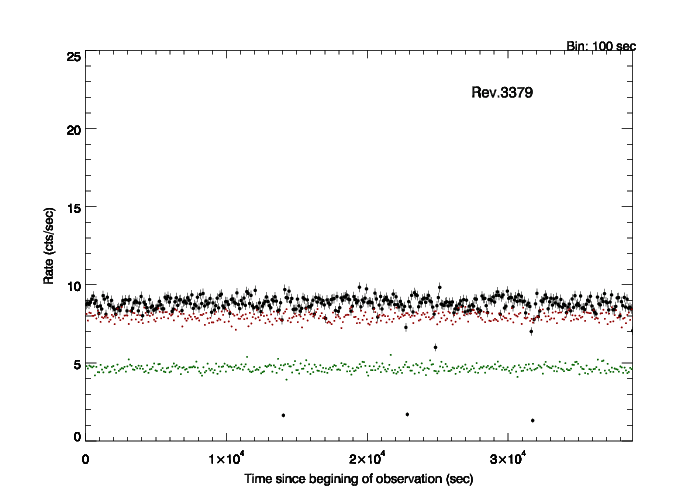
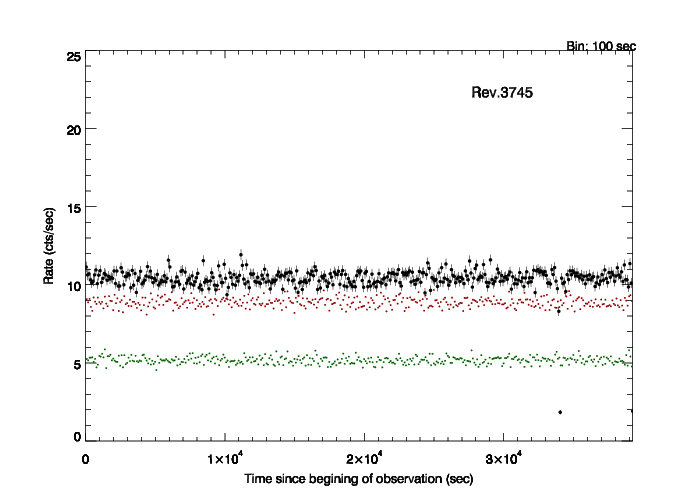
Light Curve: Combined Filter Wheel Closed filtered 100 seconds bin light curves (green tones).
The filter expression used to create these light curves is (FLAG==0 && PATTERN <= 4).
The right figure shows the
same but includes the light curves corresponding to the high and
low energy Radiation Monitor (red).
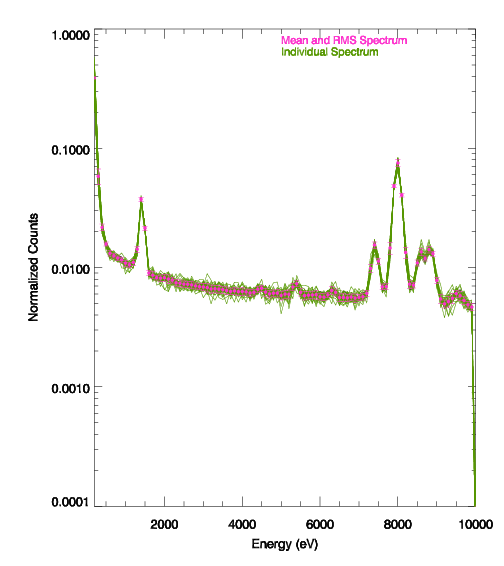
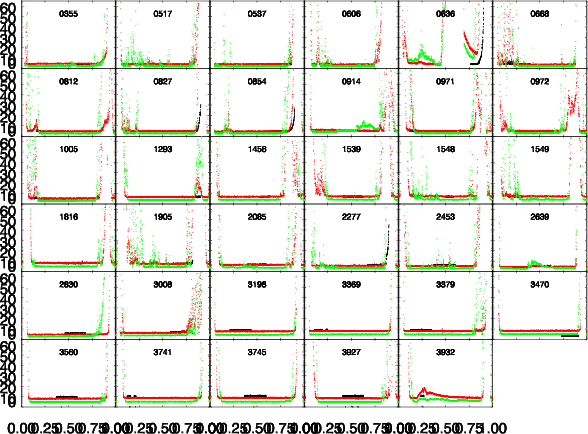
Spectra: The figure shows the individual spectrum (green) and the mean and RMS spectra (pink) of all filter wheel exposures.
The spectra are plotted in 100 eV bins and normalized to the total number of counts in the range 0.3-10 keV. The filter expression used to create these spectra is (FLAG==0 && PATTERN <= 4).
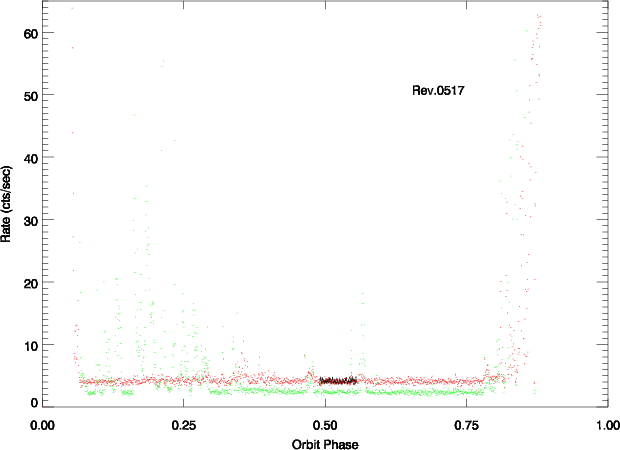
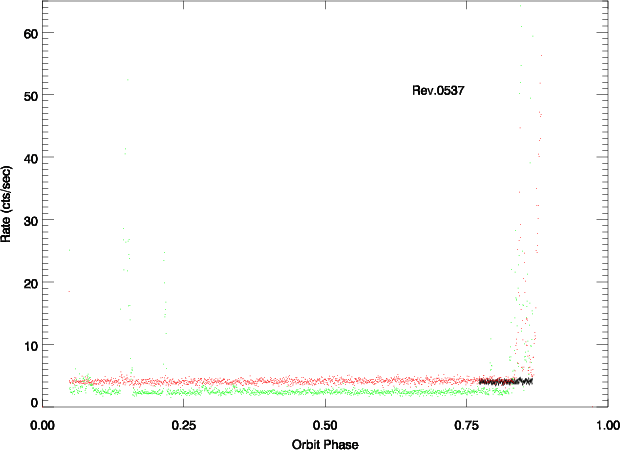
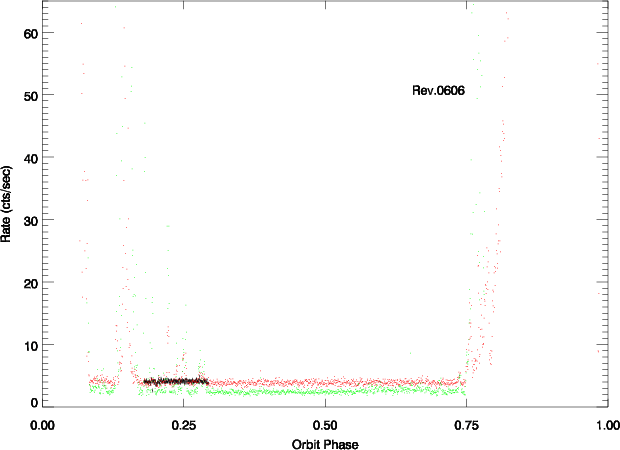
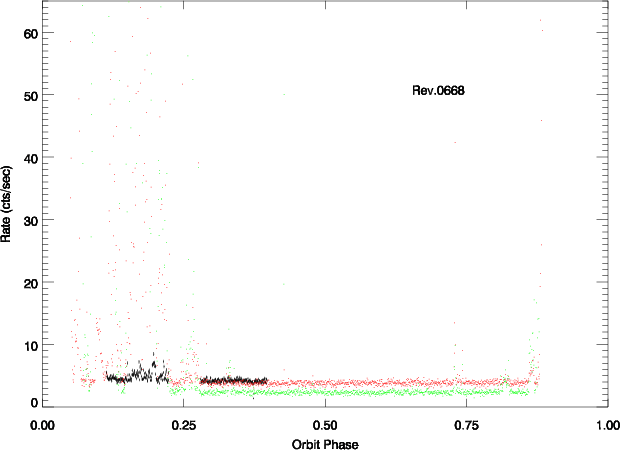
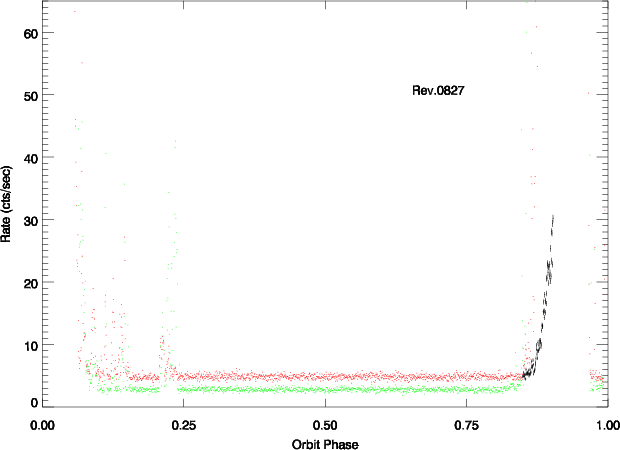
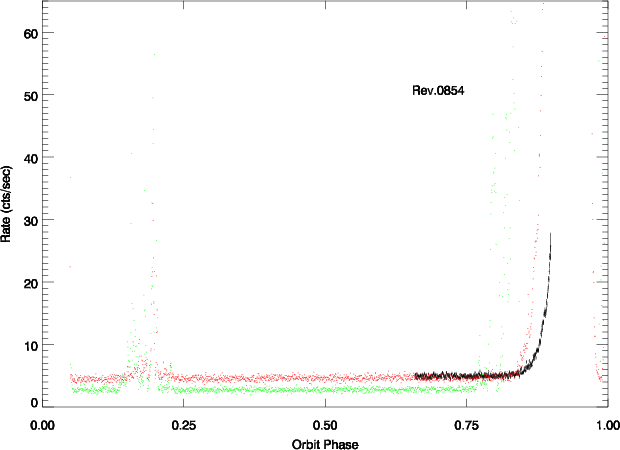
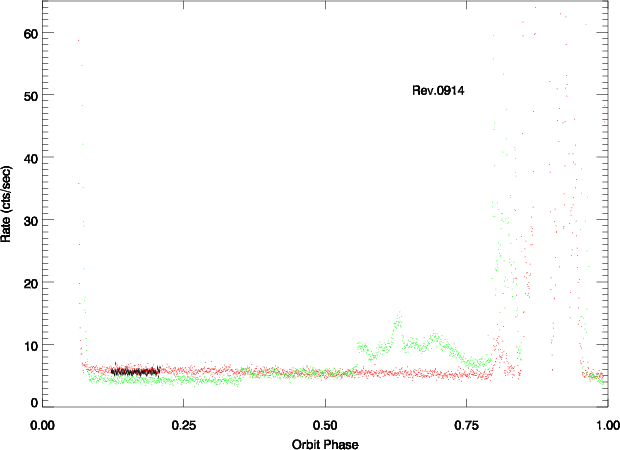
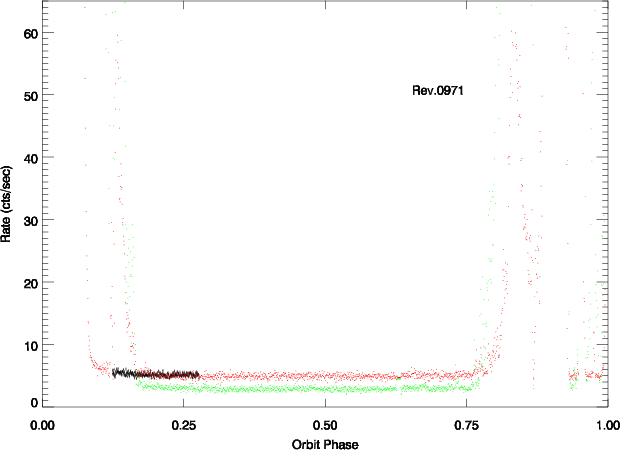
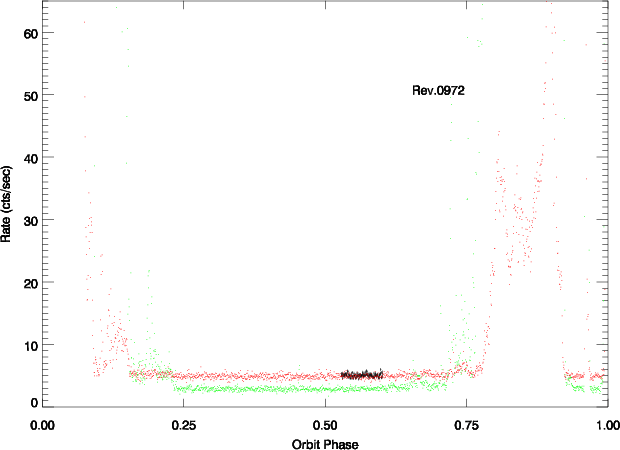
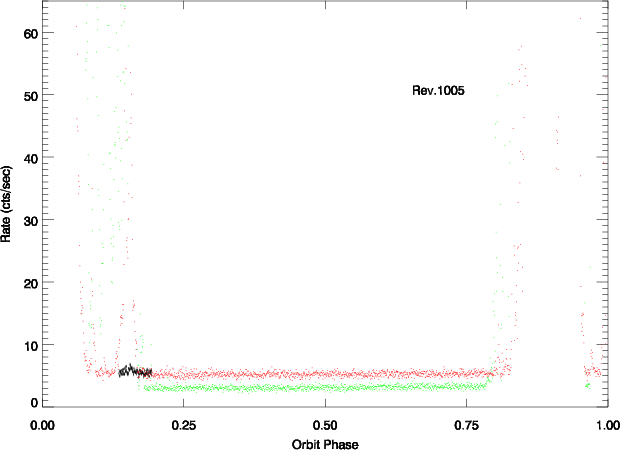
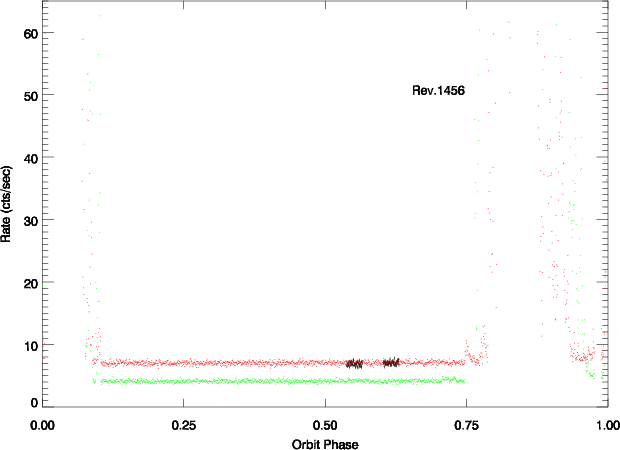
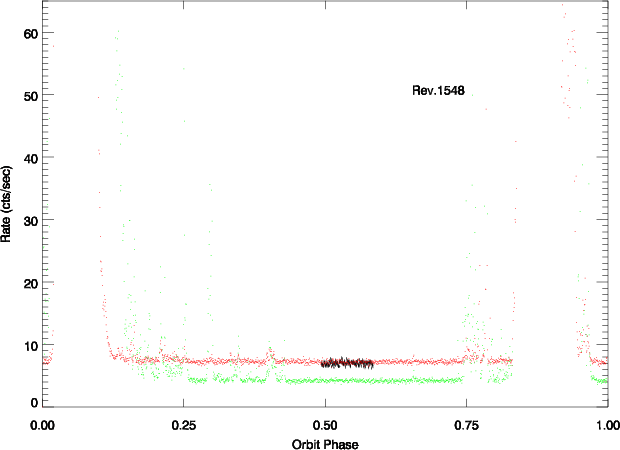
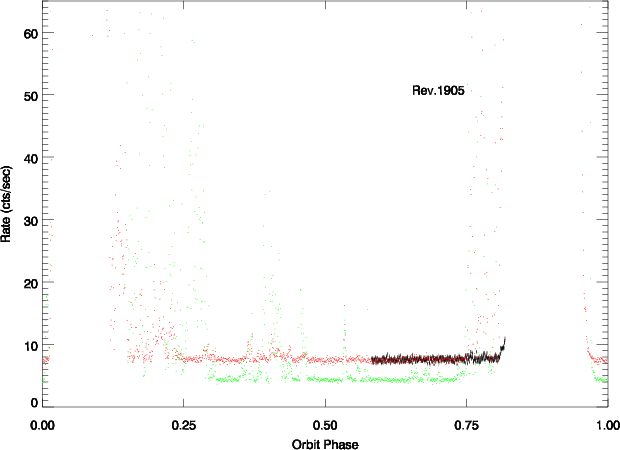
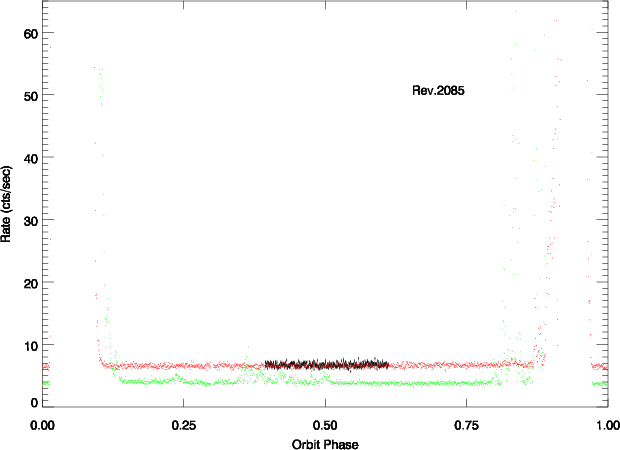
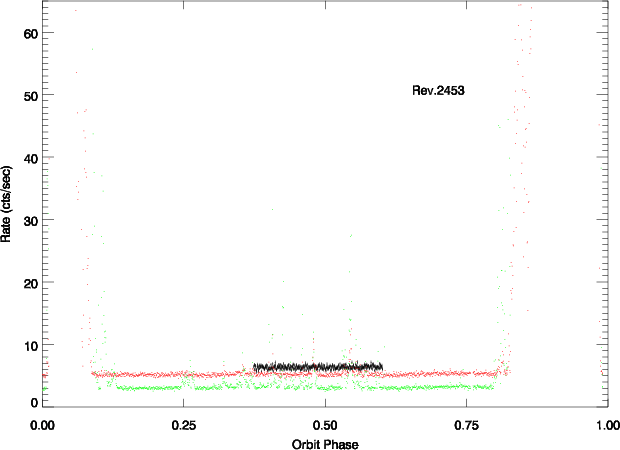
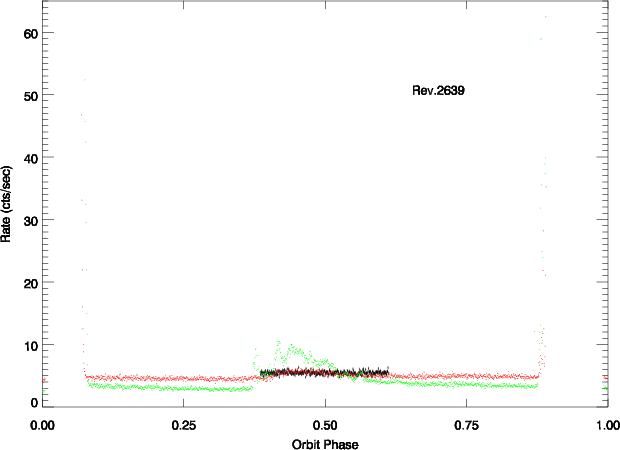
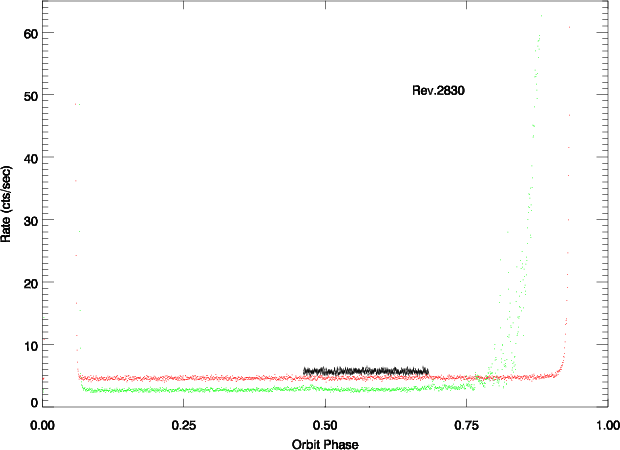
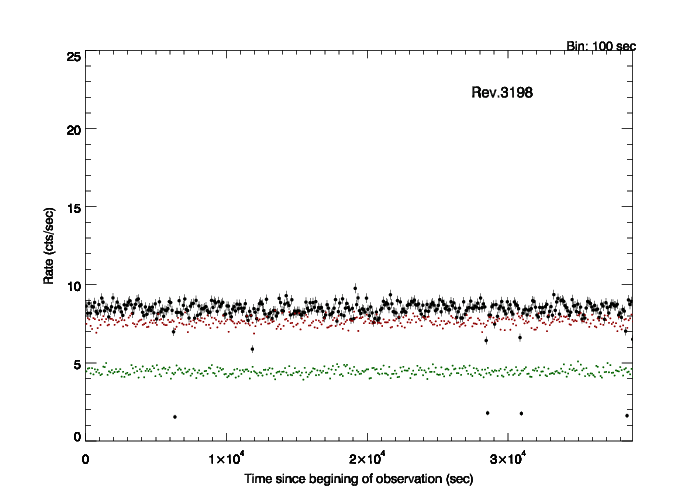
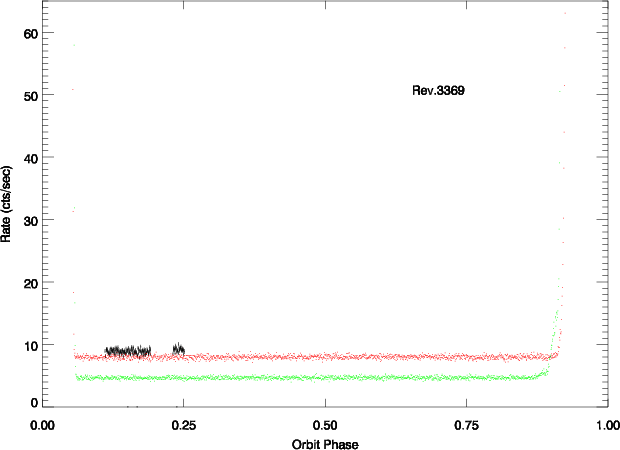
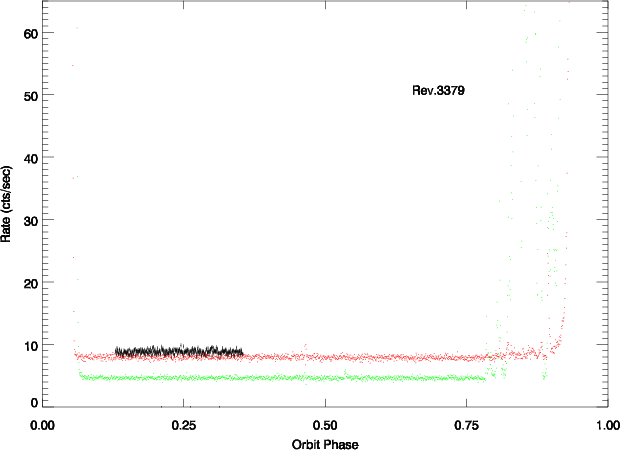
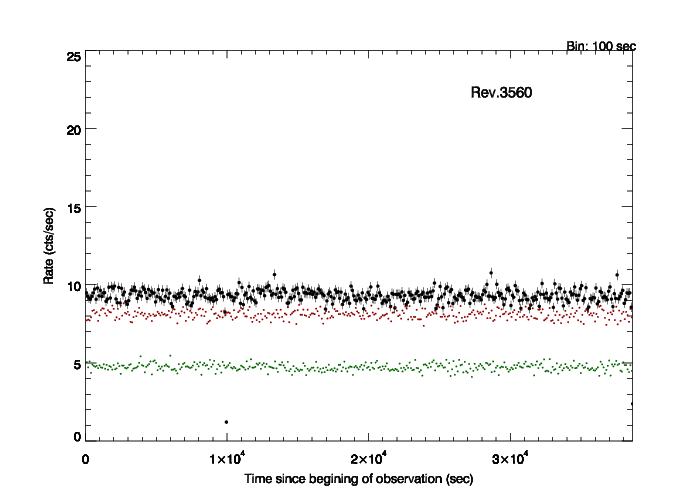
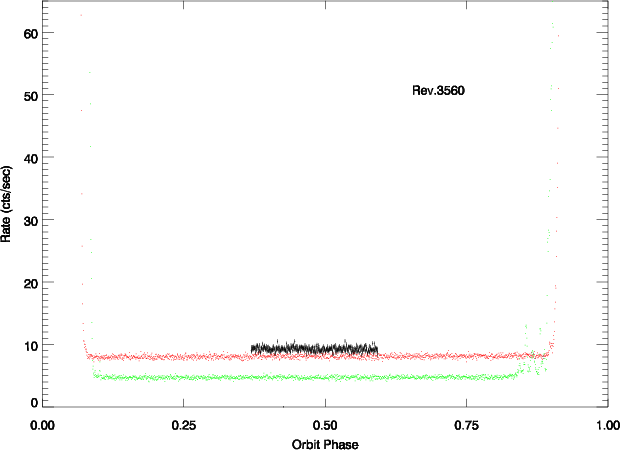
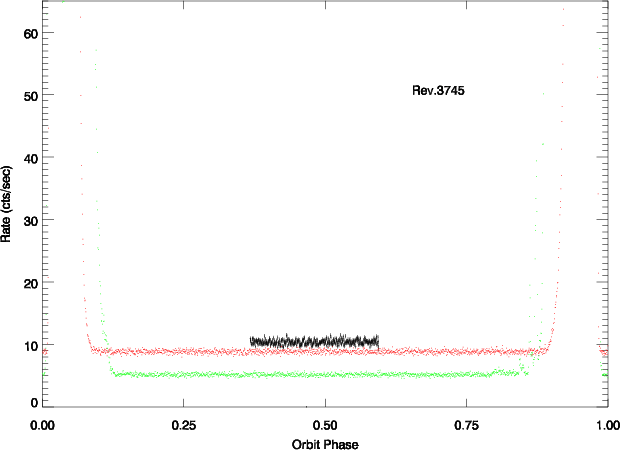
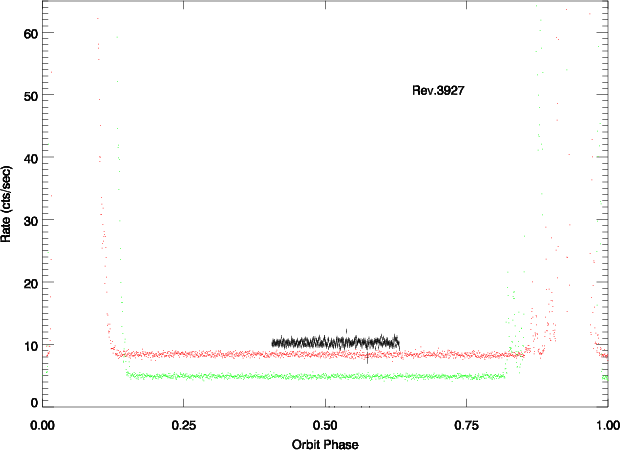
Radiation Monitor: Radiation Monitor
100 seconds bin light curves for high (red) and low (green) energy over the corresponding revolution.
Overimposed is the light curve of the corresponding Filter Wheel Closed
observation (black). Radiation Monitor data
is available here.
Individual Events List: Filter Wheel Closed events list ([rev]_[obsid]_[instr]_[expid]).
The individual events files have been filtered for periods of background flaring.
Columns containing the revolution number (Rev), the observation id (Obsid) and the exposure id (Expid) corresponding to each event have been added to the merged events list.
A column Weight has been added to the events lists that contains, for each event, the inverse effective area over one exposure.
The SAS task evigweight has been used to compute these weights.
Time[ks]: Duration of the Filter Wheel Closed exposure in units of kilosecond.
Observation Start: UTC date and time corresponding to the begining of the observation.
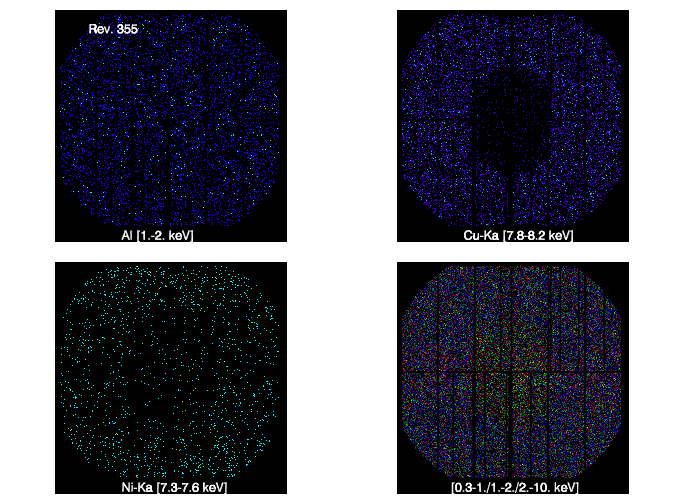
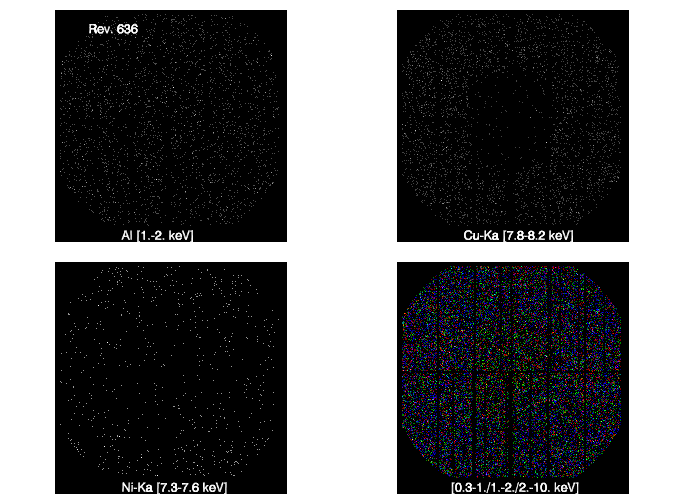
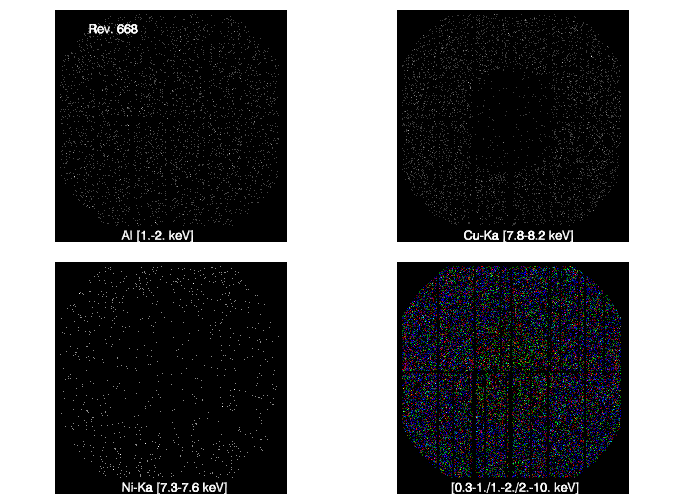
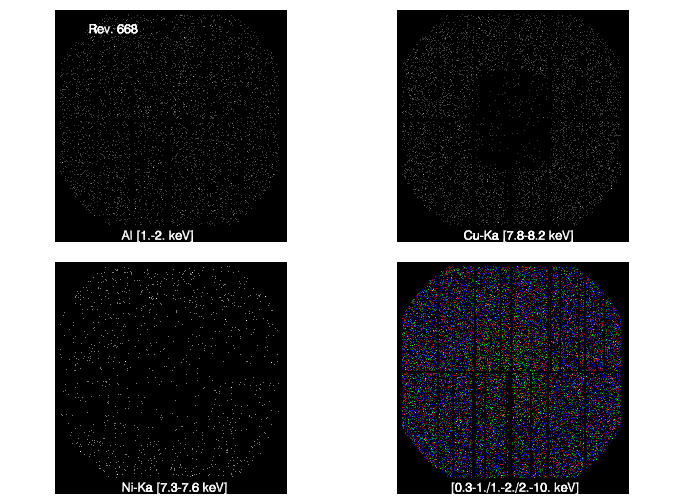
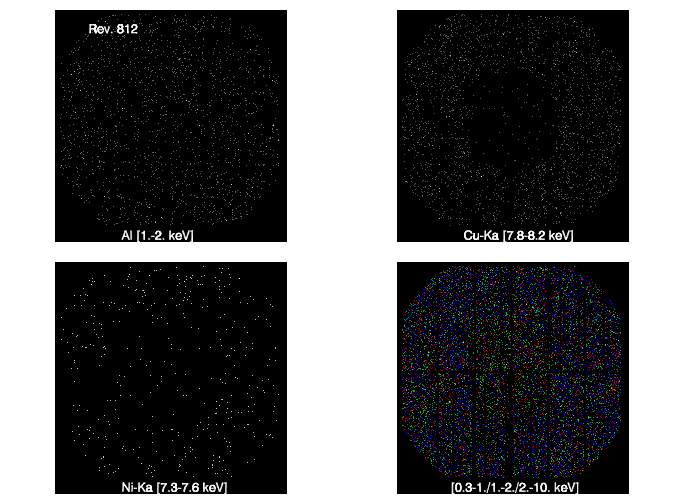
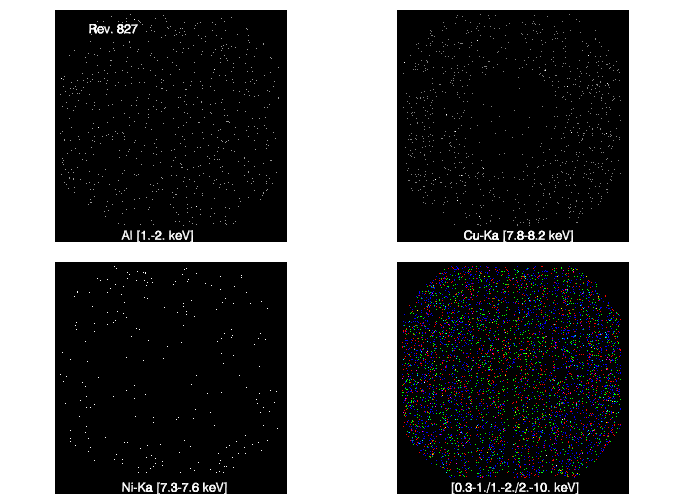
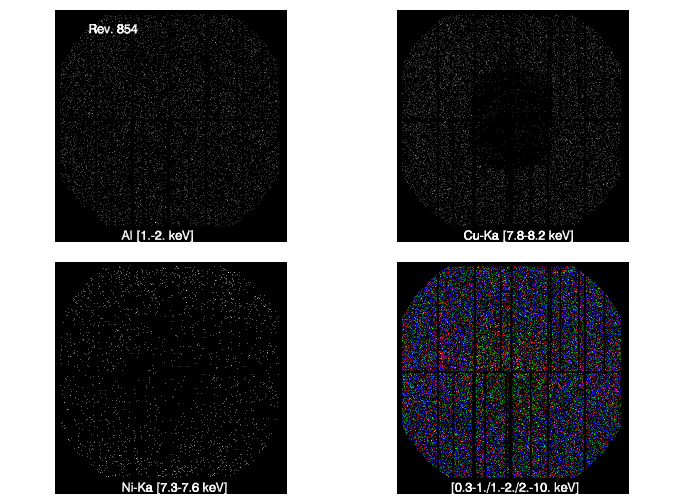
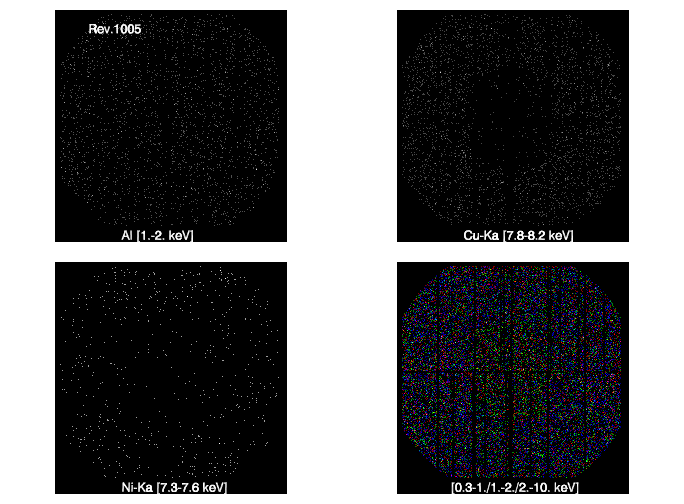
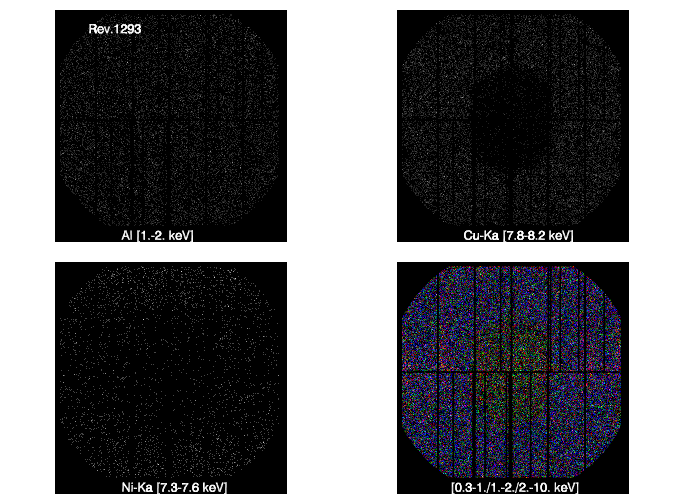
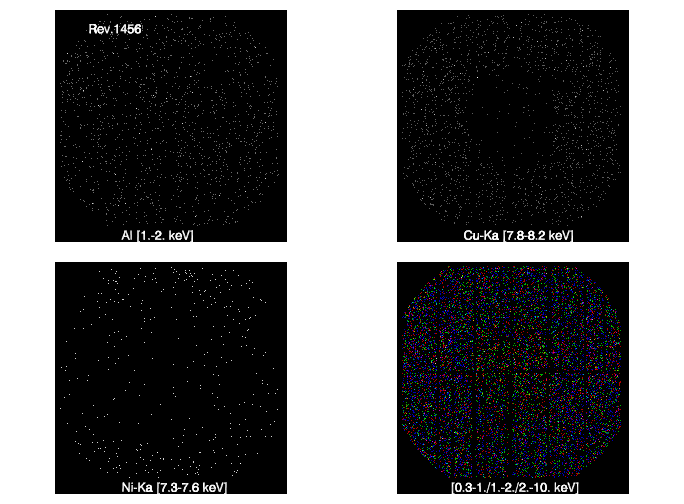
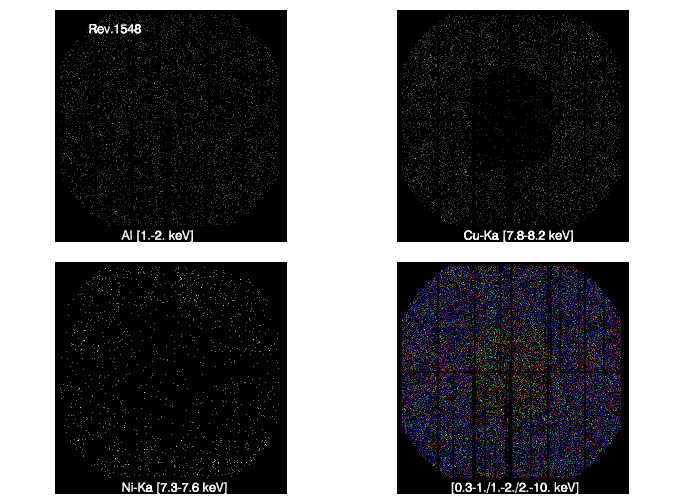
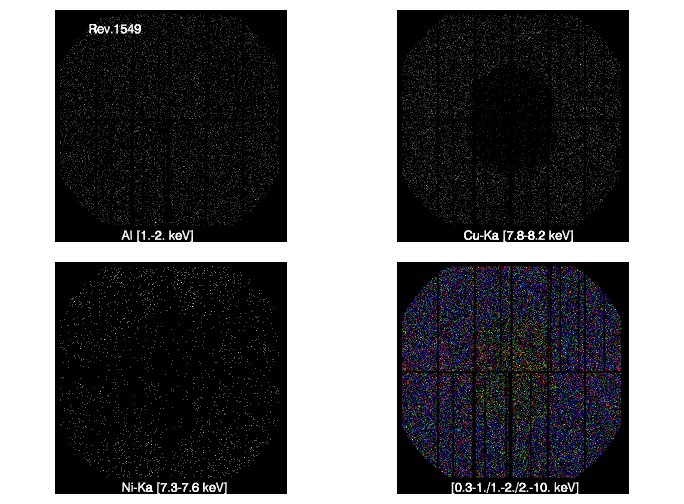
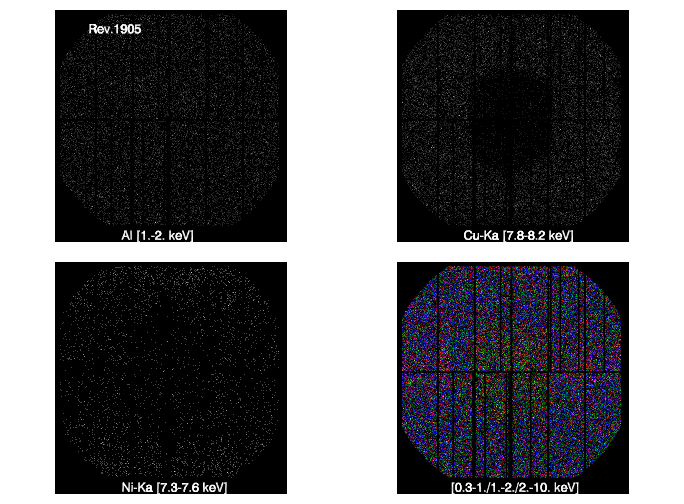
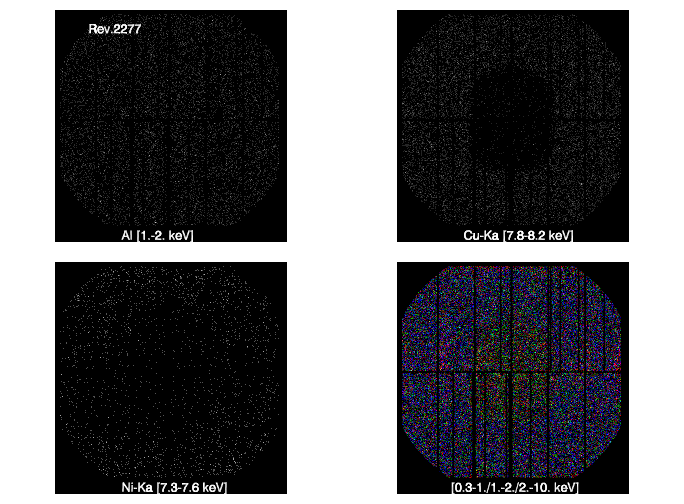
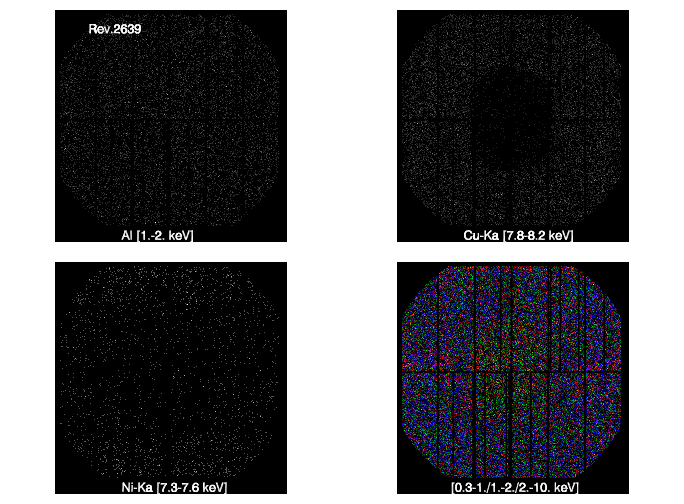
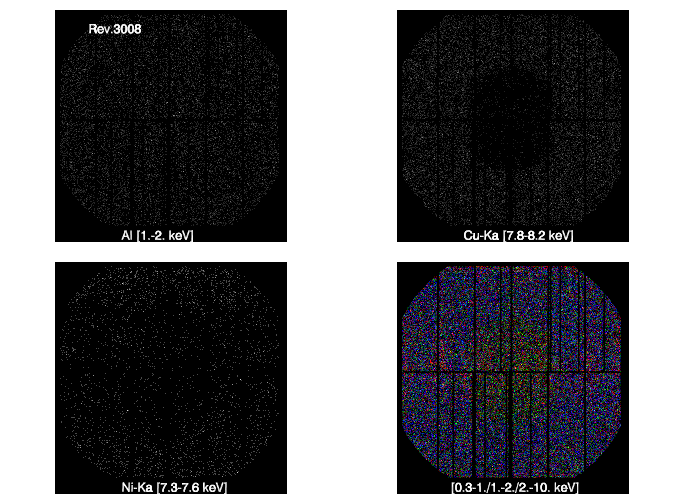
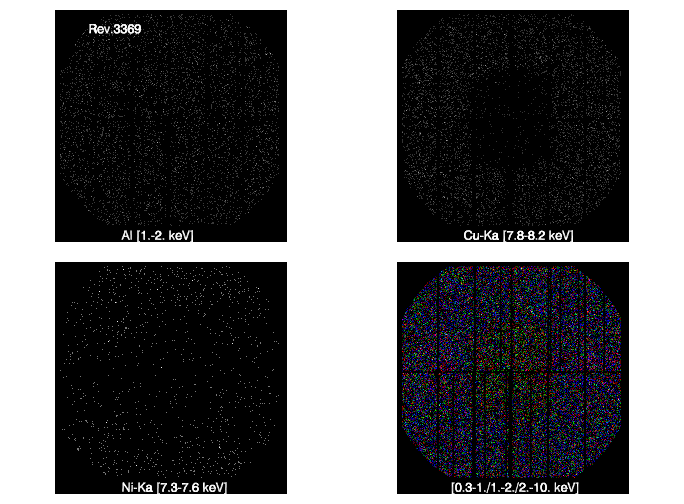
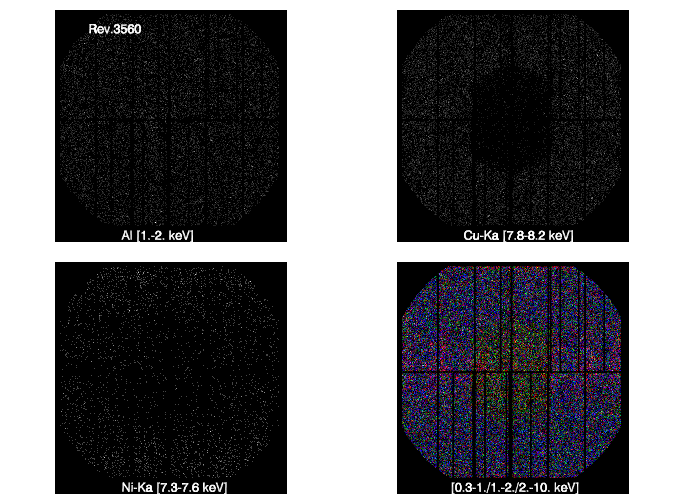
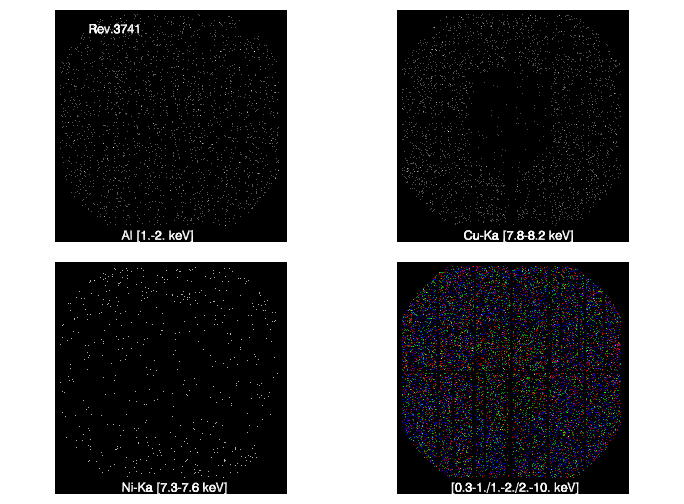
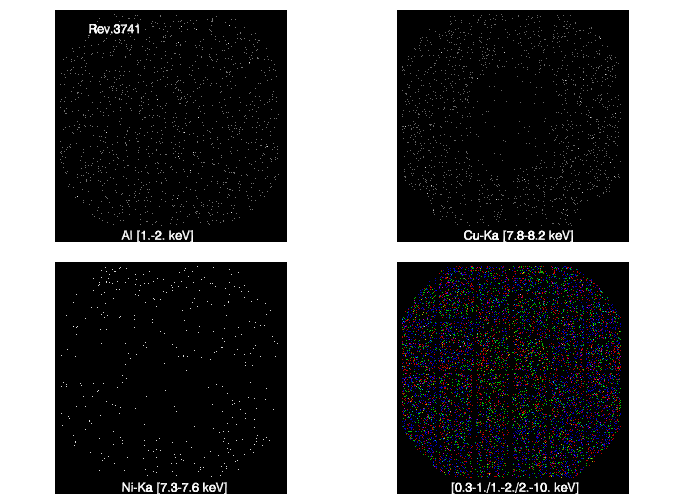
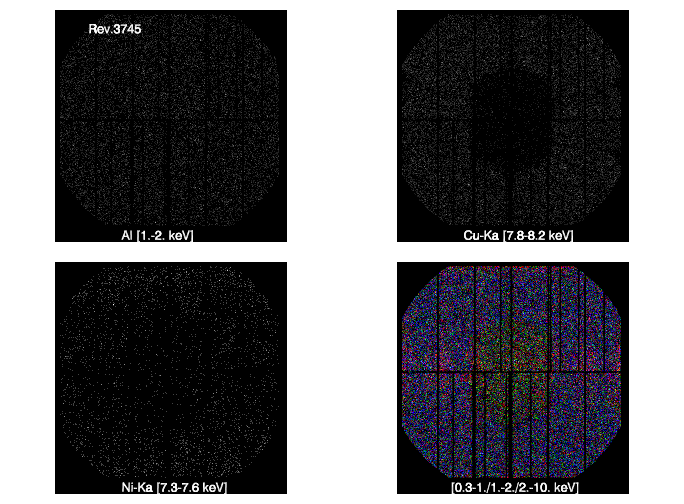
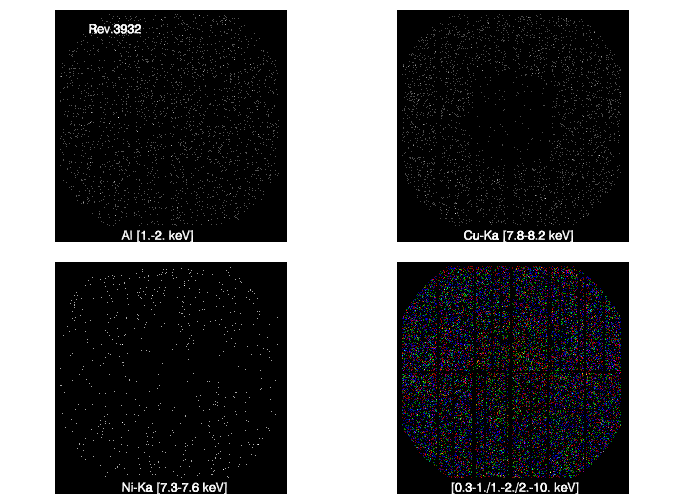
Image: Filter Wheel Closed filtered image in detector coordinates (DETX, DETY). The filter expression used to create these
images is (FLAG==0 && PATTERN <= 4).
Within each figure, four images are shown corresponding to different energy ranges:
Top Left, energy range 1-2 keV; Top Right, energy range 7.8-8.2 keV; Bottom Left, energy range 7.3-7.6 keV; Bottom Right, false color image (0.3-10. keV).
These energy ranges have been chosen to highlight known instrumental spectral features (see the EPIC Background section of the
XMM-Newton User Handbook for more details).
Note: This set of images is meant to show any spacial structure that could be present, so for displaying purposes, each image has been optimized based on its
average number of counts. Hence, images corresponding to different energy ranges or different events files are not to scale.
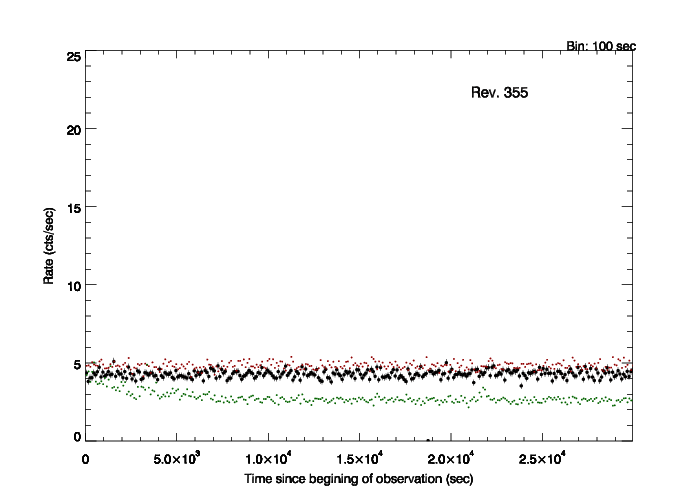
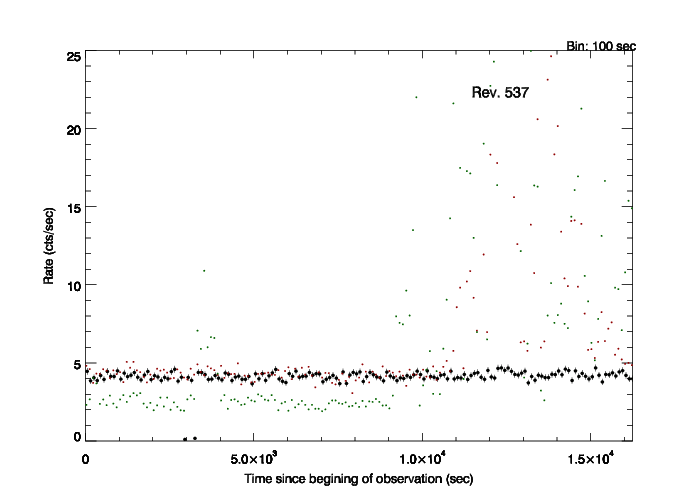
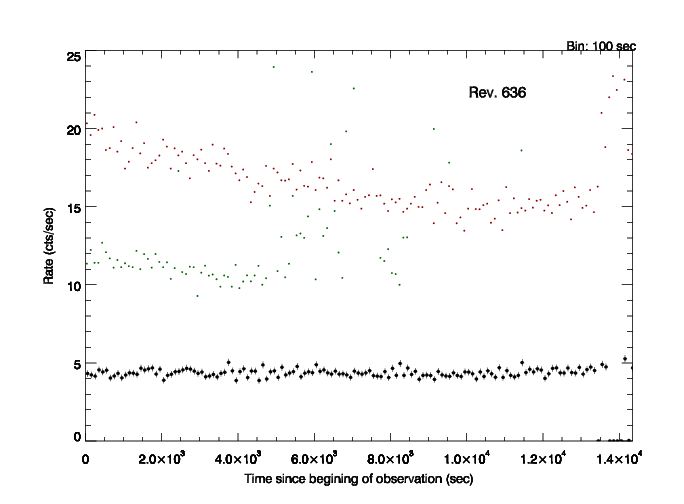
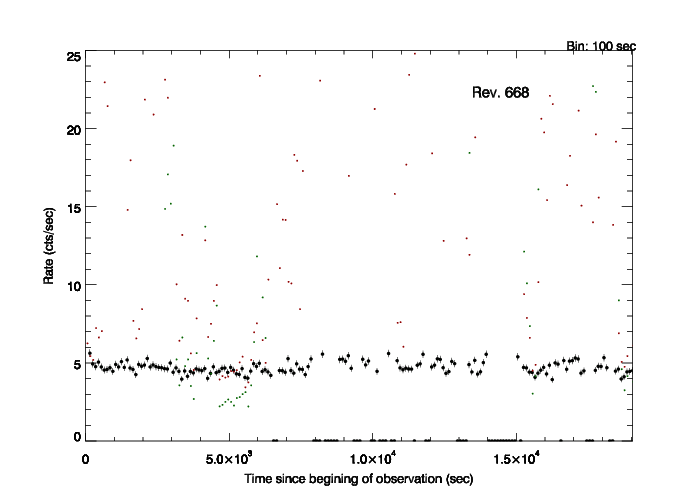
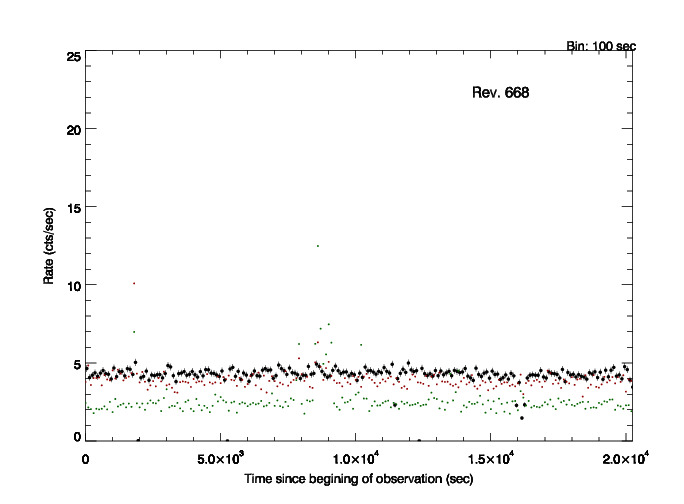
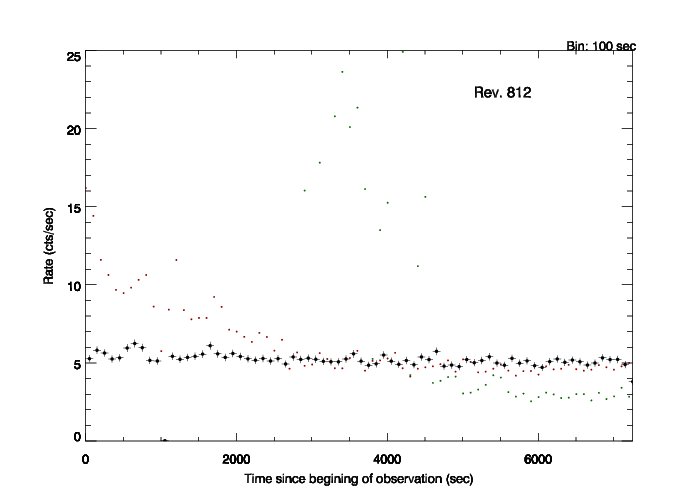
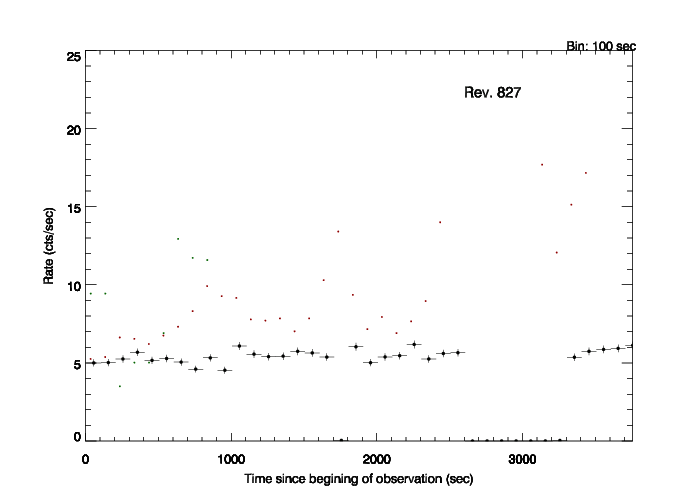
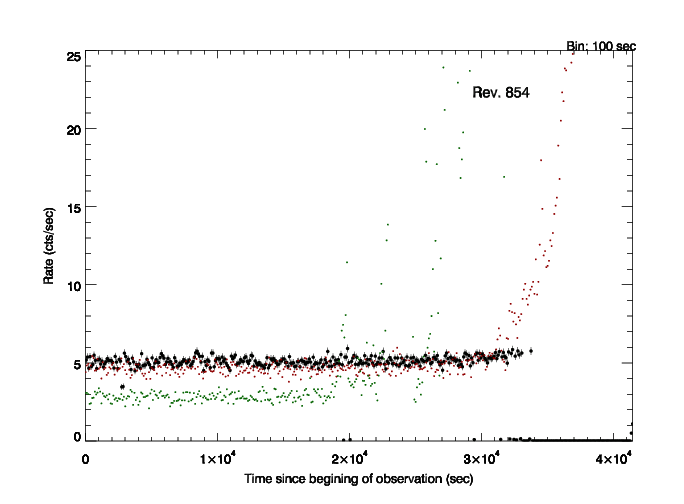
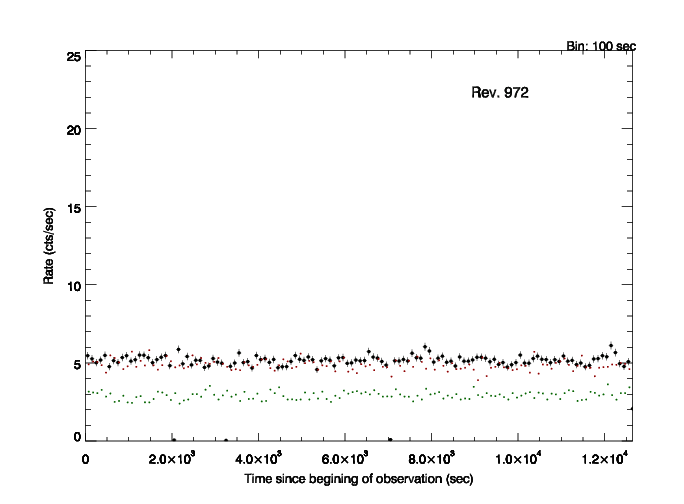
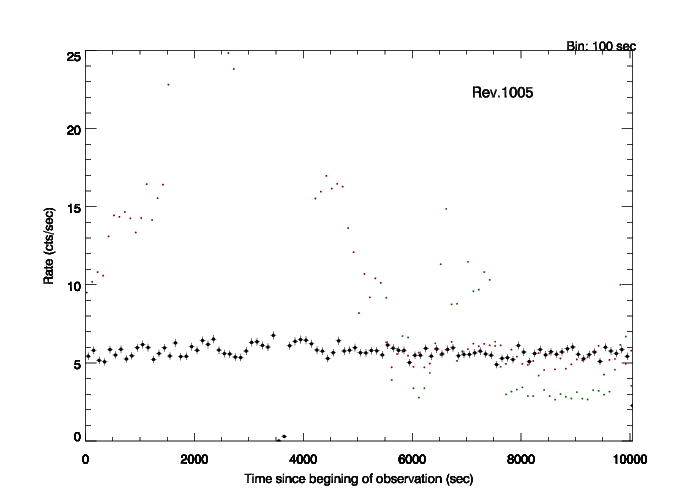
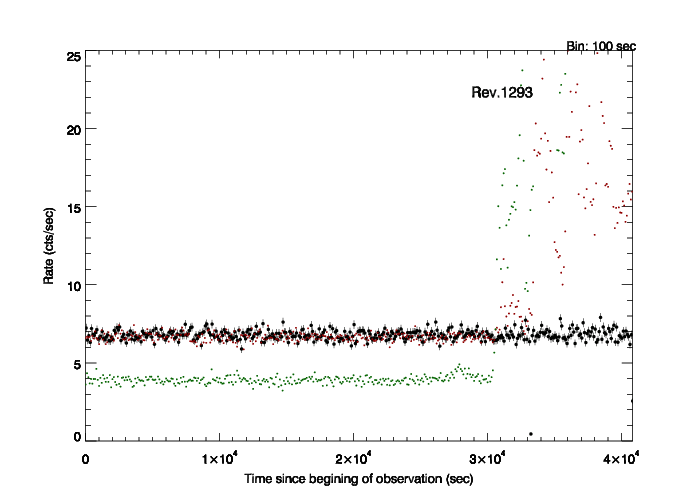
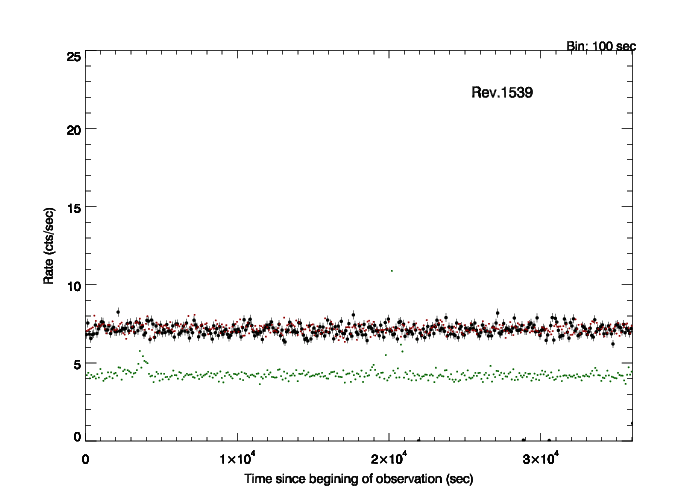
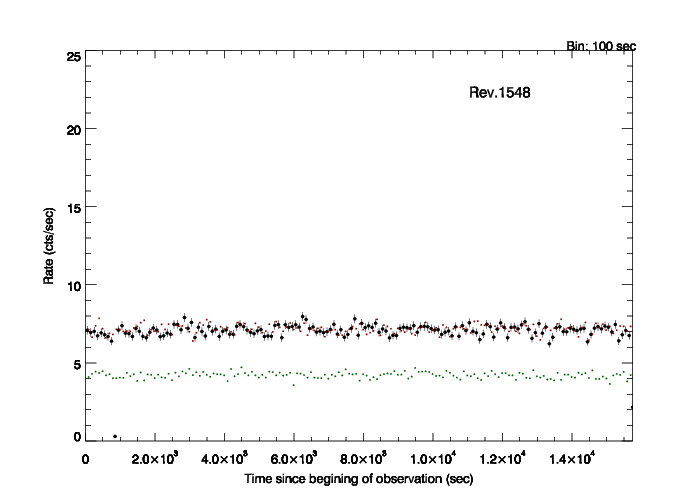
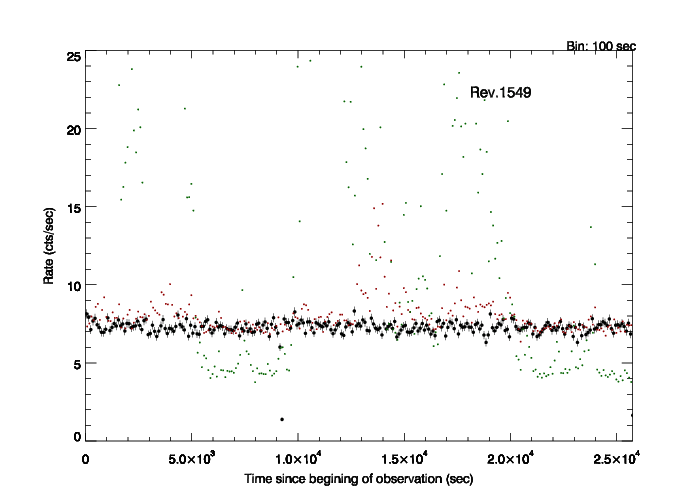
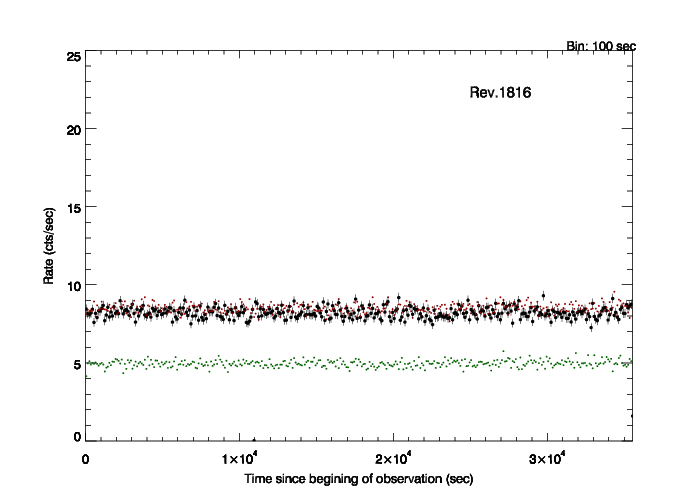
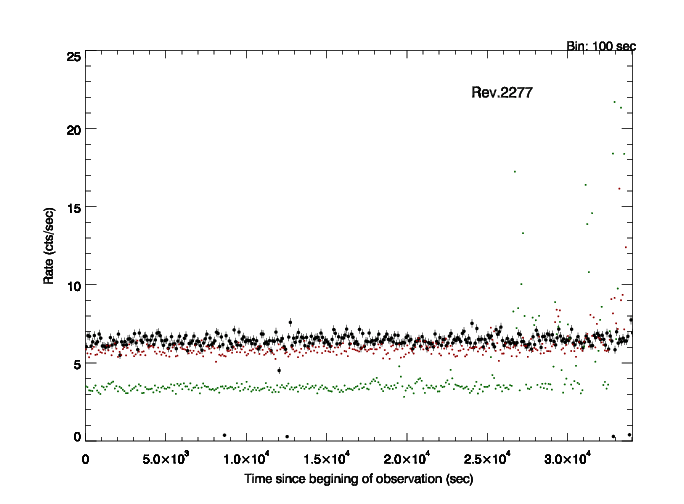
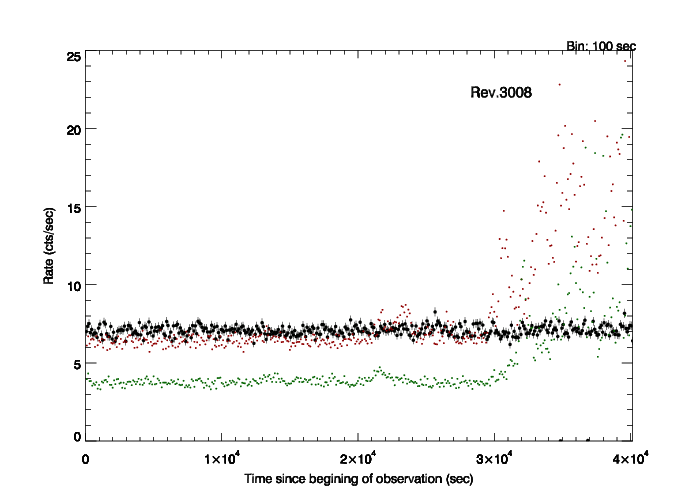
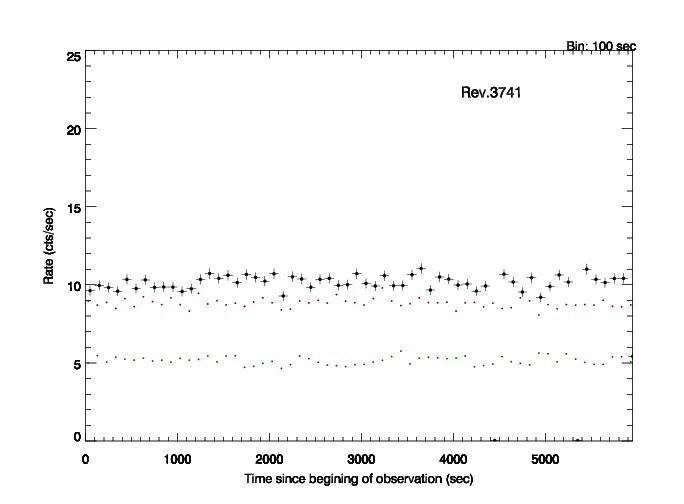
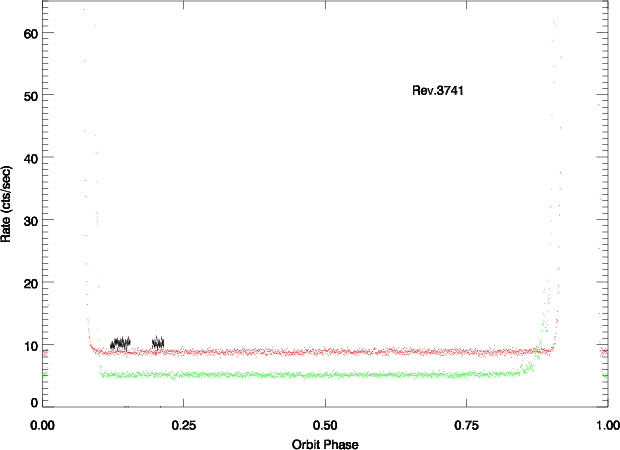
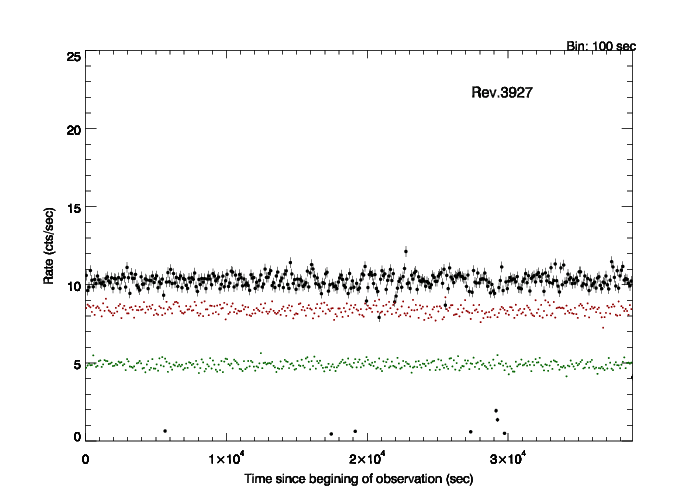
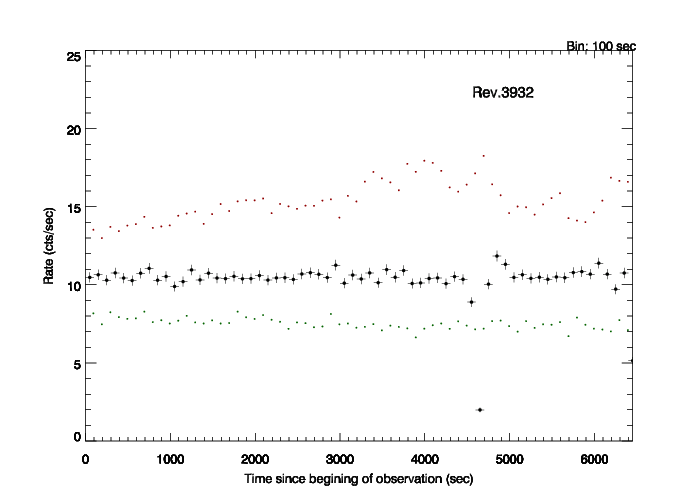
Light Curve: Filter Wheel Closed filtered 100 seconds bin light curves (green tones).
The filter expression used to create these light curves is (FLAG==0 && PATTERN <= 4).
The figure includes as
well the light curves corresponding to the high and low energy Radiation Monitor (red).
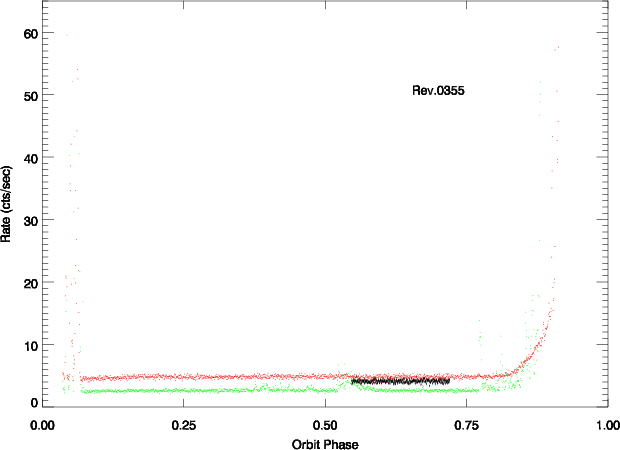
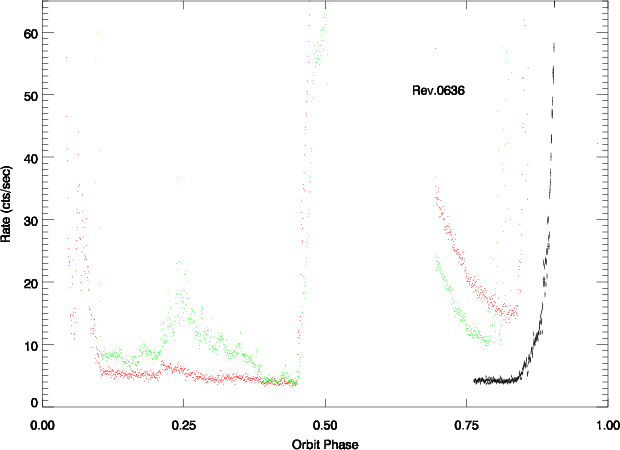
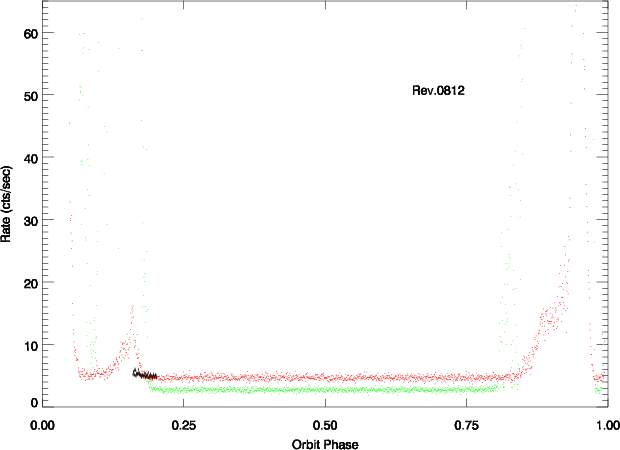
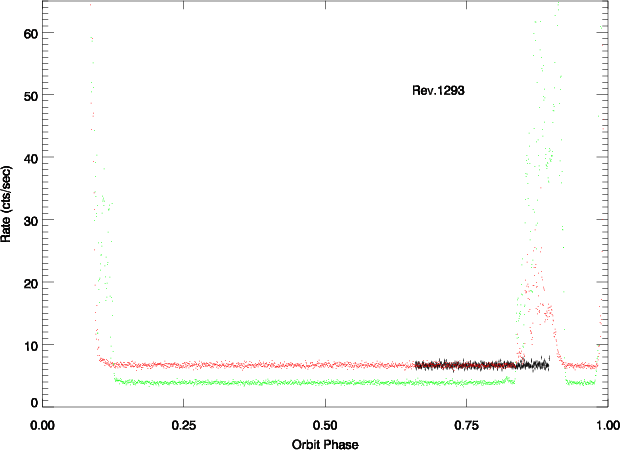
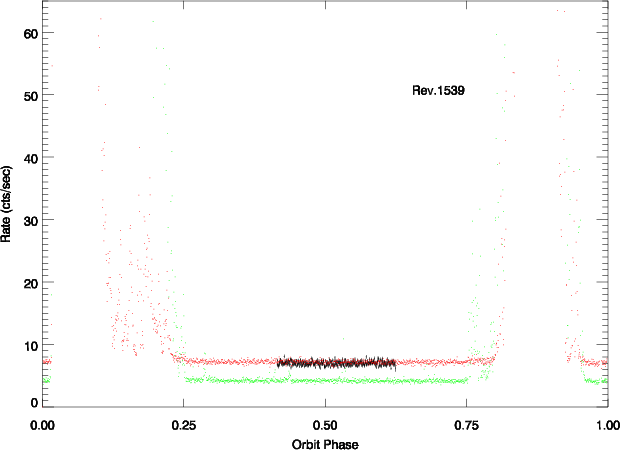
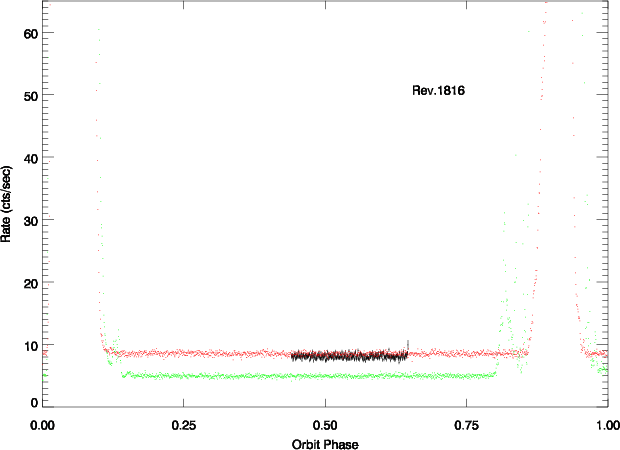
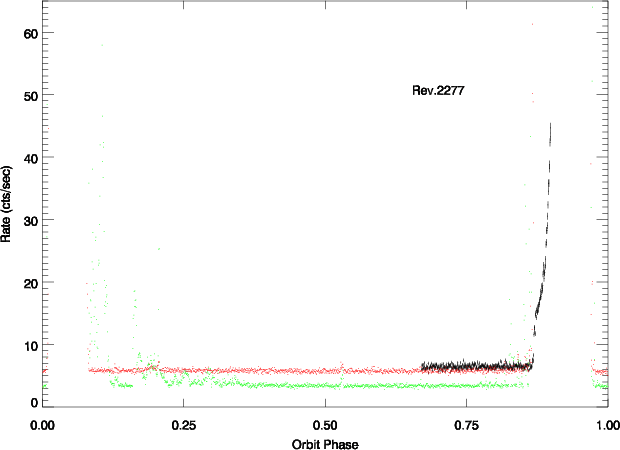
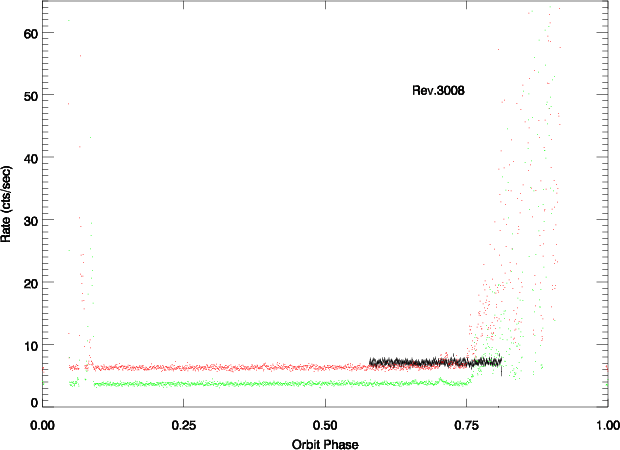
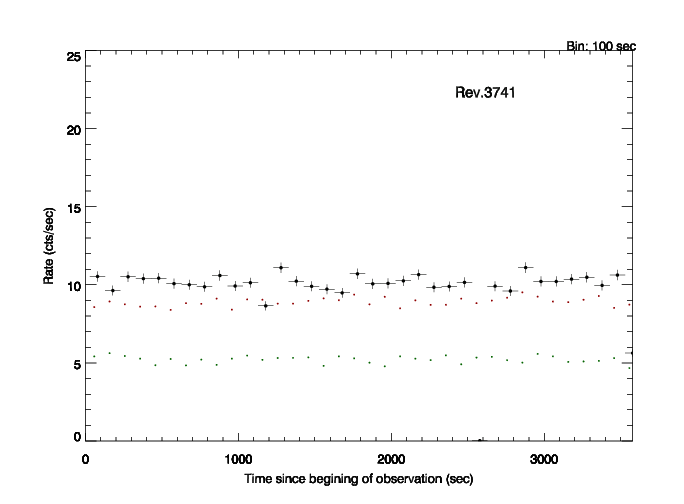
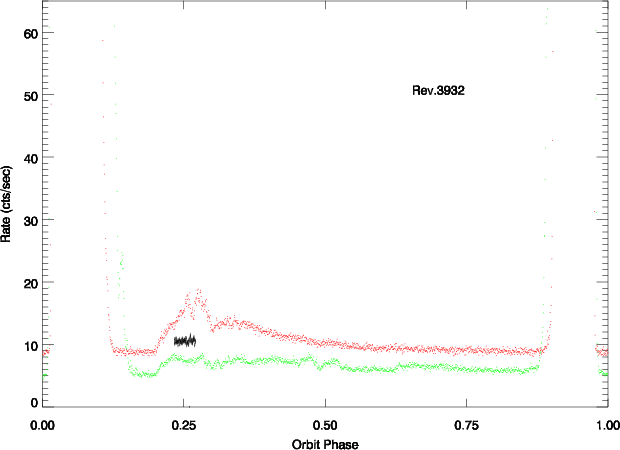
Radiation Monitor: Radiation Monitor
100 seconds bin light curves for high (red) and low (green) energy over the corresponding revolution.
Overimposed is the light curve of the corresponding Filter Wheel Closed
observation (black). Radiation Monitor data
is available here.
General Notes
For the mode-specific spectral and pattern distributions the interested reader
is referred to the corresponding
calibration report (Sect.4).
The set-up change influences the interpretation of the discarded line counter,
see Fig.10 of the abovementioned report and the appendix of the
early report.
[General]
[pn][MOS1][MOS2]