| Merged Events List | File Size | Total Time | Image | Light Curve | Spectra | Radiation Monitor |
| (Rev.266 - Rev.4027) | [Mb] | [ks] | [DETX/DETY] | [cts/sec] | [Norm. cts] | [cts/sec] |
| Merged Events File | 855 | 755.7 |
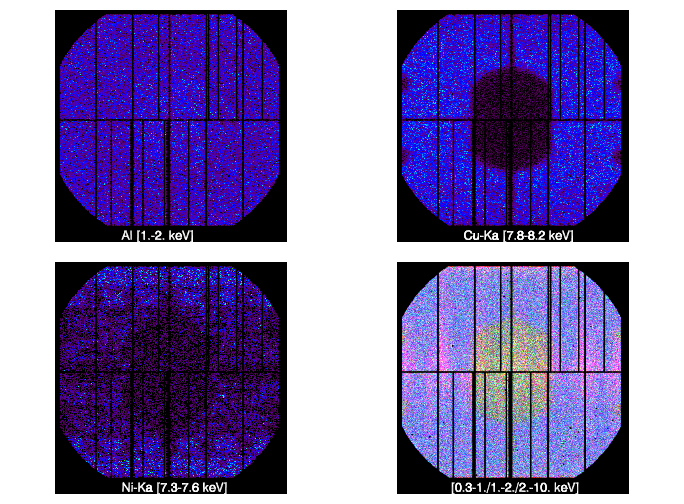
(ps file) |
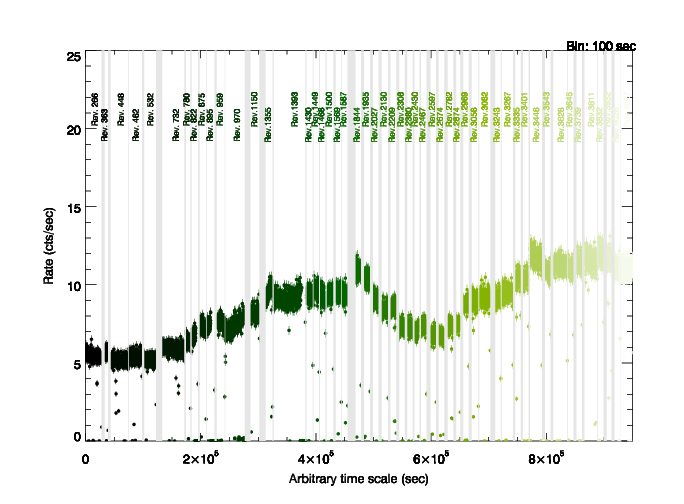
(ps file) (ps file) |
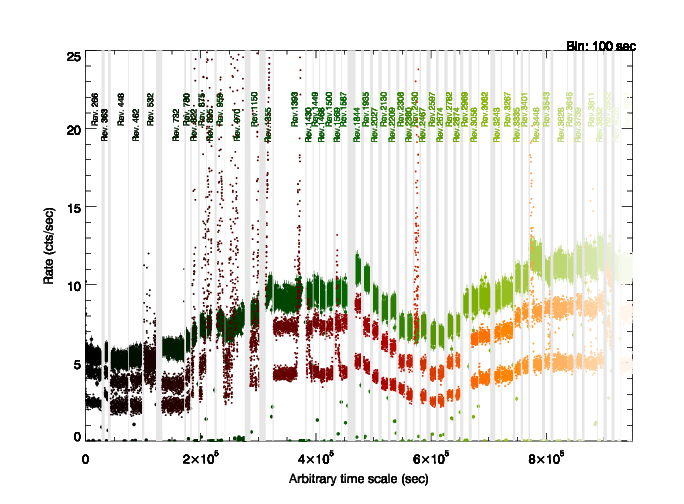
(ps file) |
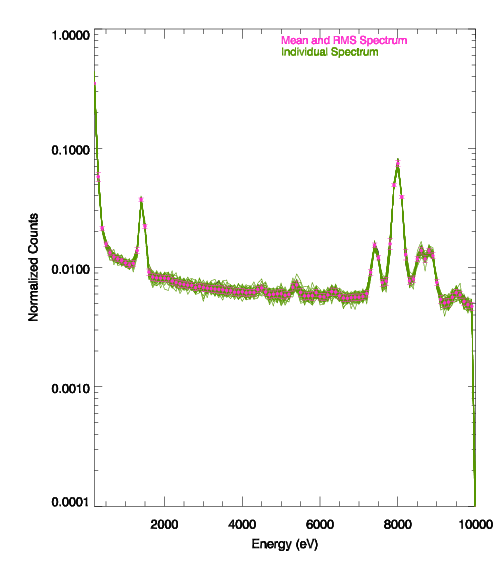
(ps file) |
| Merged OoT Events File | 943 | 755.7 |
| Individual Events List | Time | Observation Start | Image | Light Curve | Radiation Monitor |
| [ks] | [UTC Date] | [DETX/DETY] | [cts/sec] | [cts/sec] | |
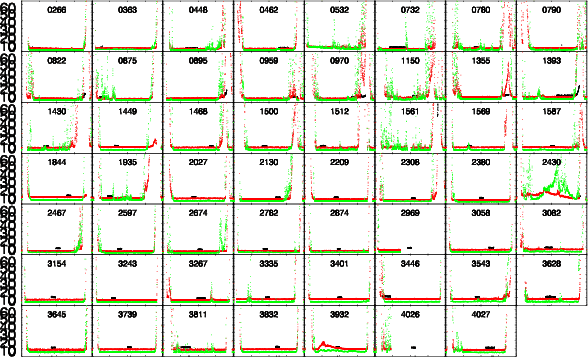
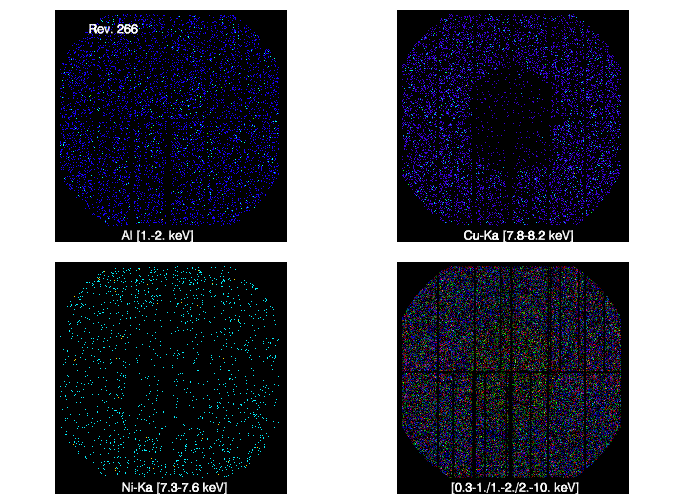
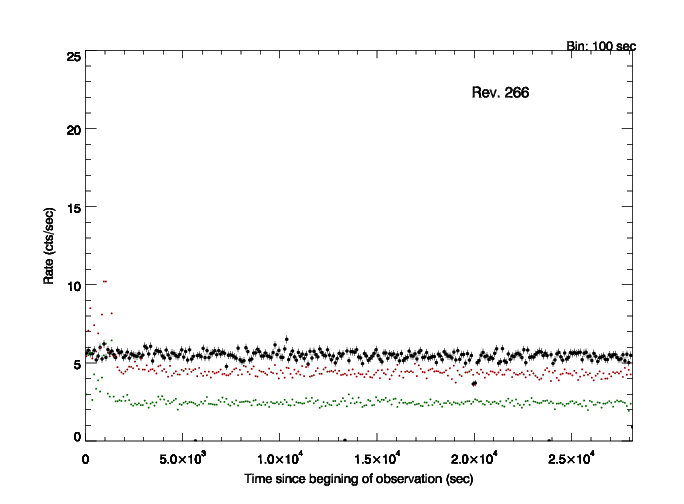
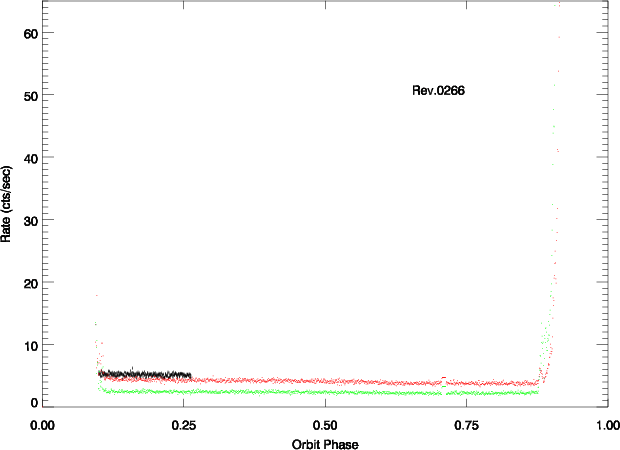
| 0266_0136750301_EPN_U002 | 28.1 | 2001-05-22T06:06:51.0 |
|
|
|
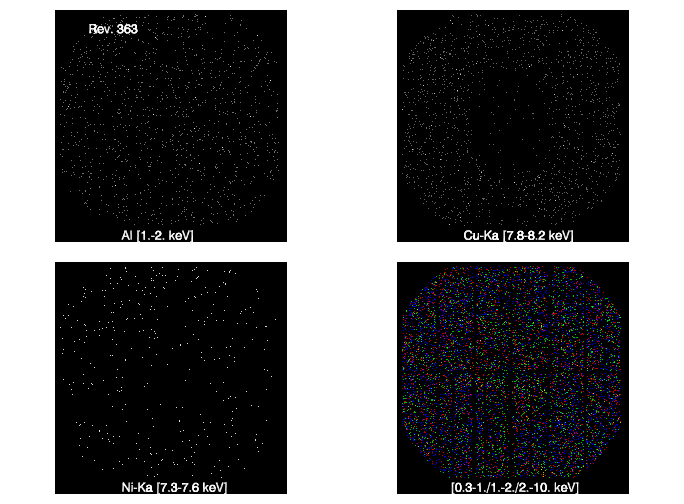
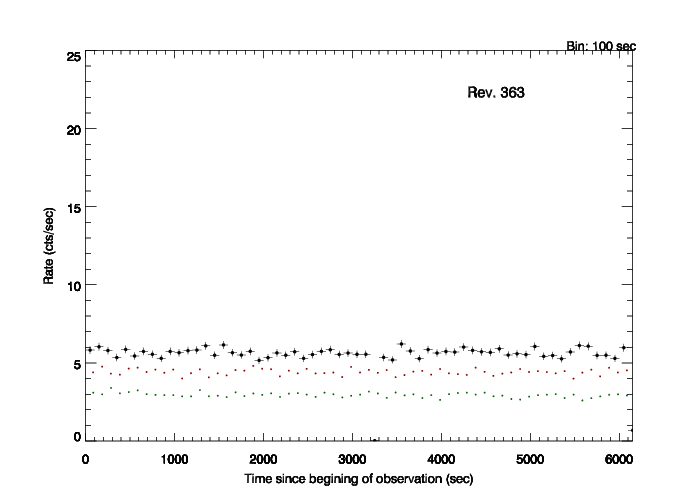
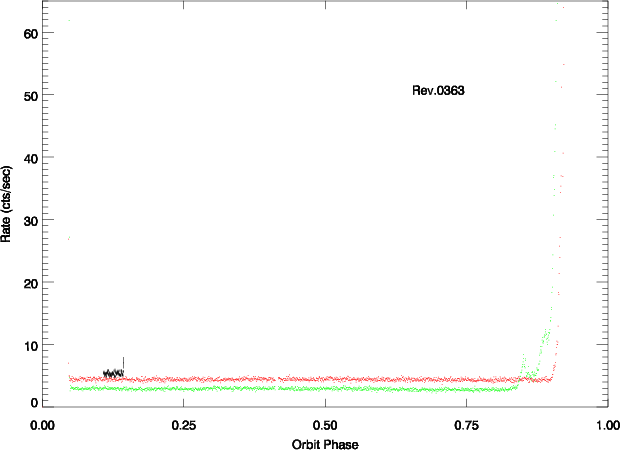
| 0363_0112830701_EPN_S005 | 6.1 | 2001-12-01T19:37:07.0 |
|
|
|
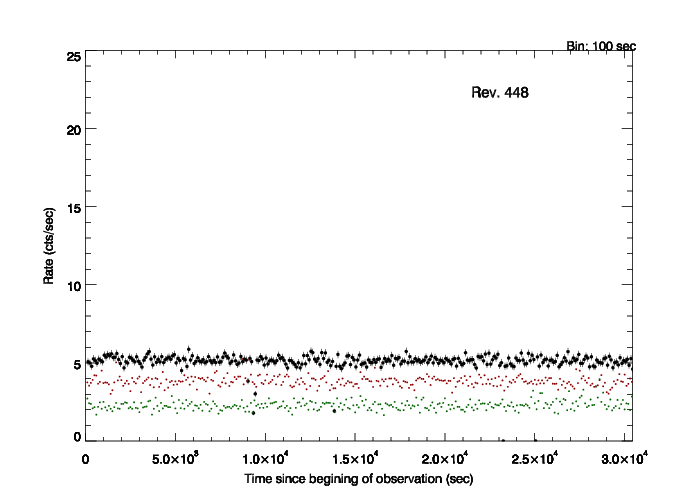
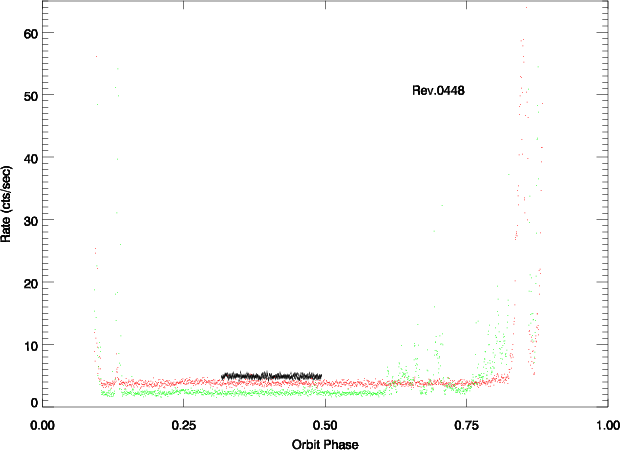
| 0448_0153750701_EPN_S008 | 30.5 | 2002-05-20T19:59:40.0 |

|
|
|
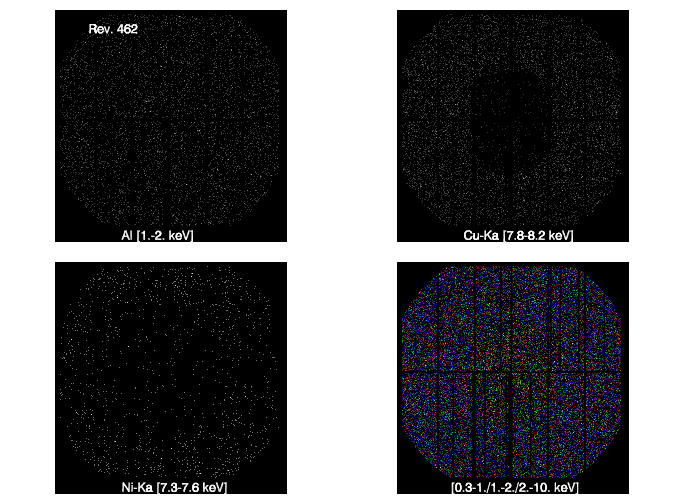
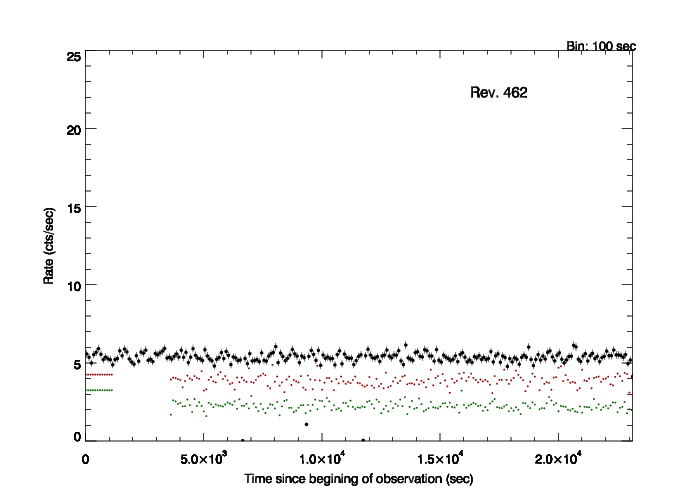
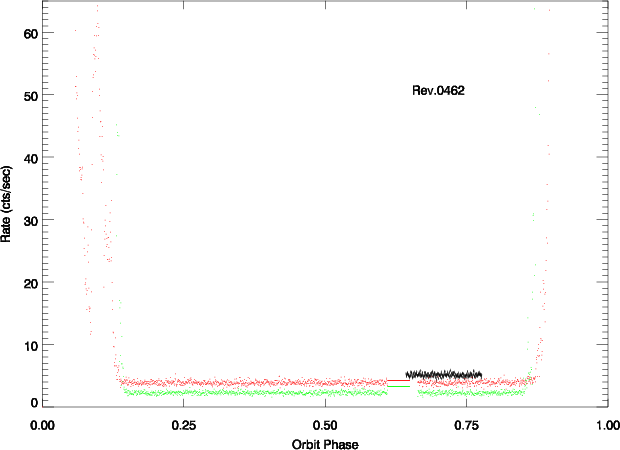
| 0462_0134521601_EPN_S005 | 23.2 | 2002-06-18T09:53:21.0 |
|
|
|
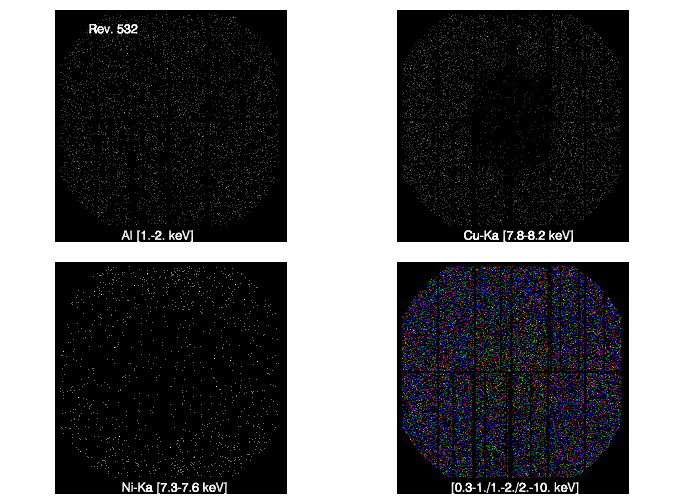
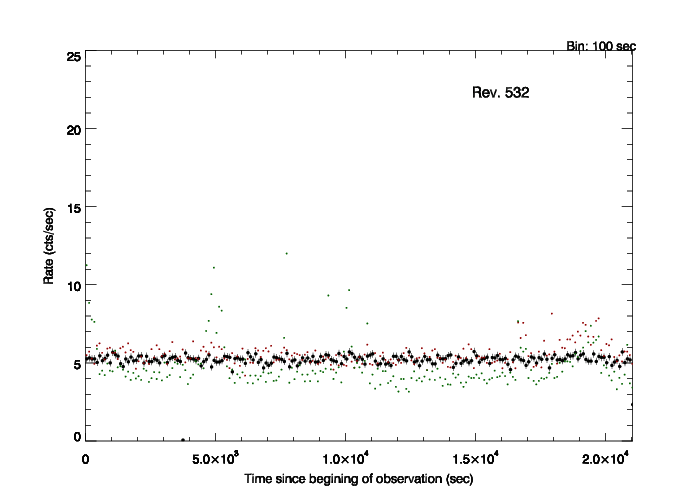
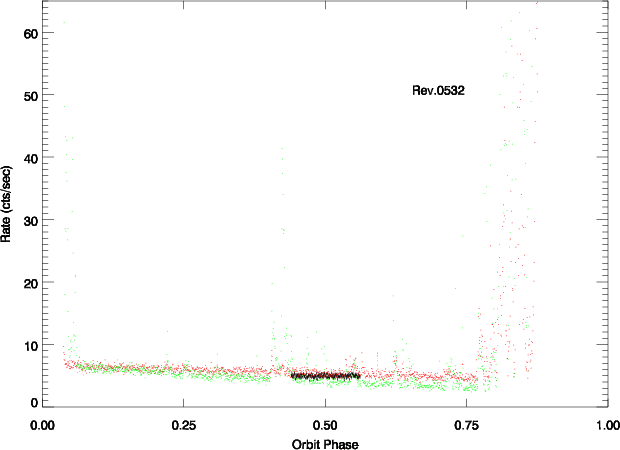
| 0532_0136540501_EPN_S008 | 21.0 | 2002-11-04T15:21:19.0 |
|
|
|
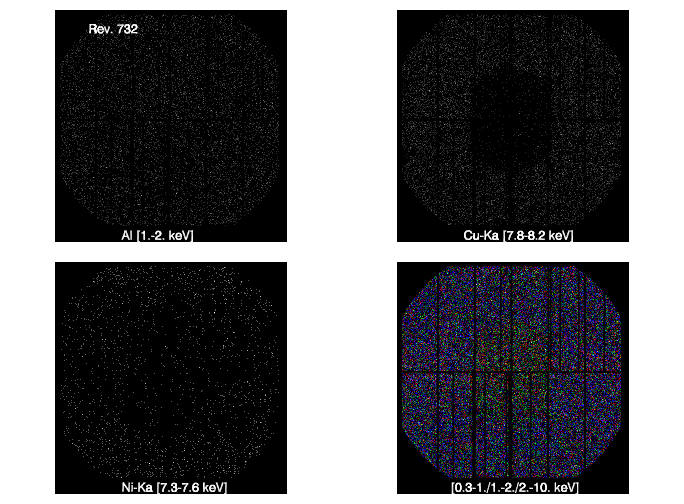
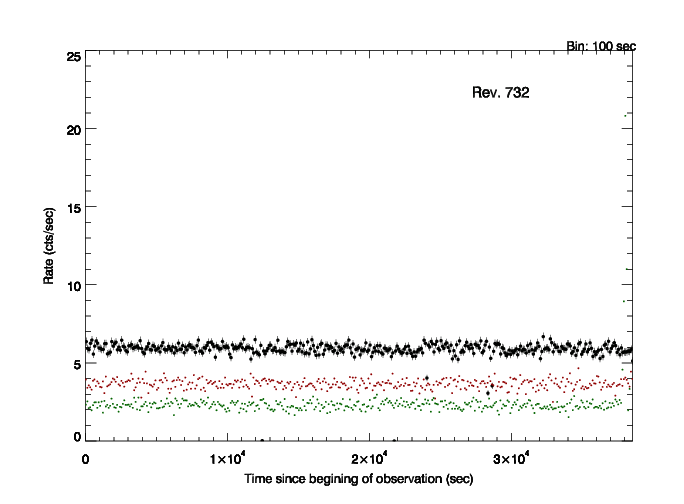
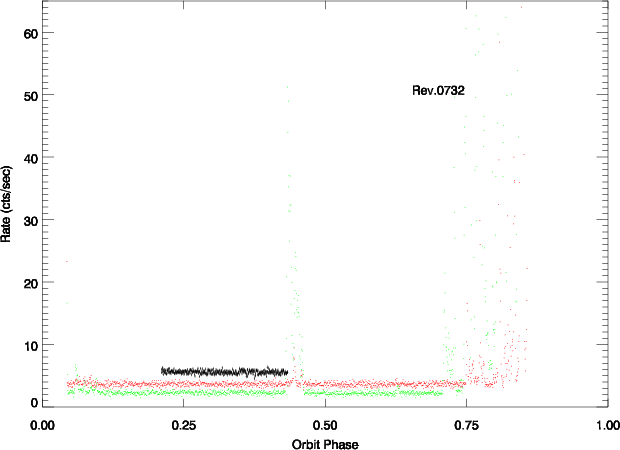
| 0732_0160362801_EPN_S005 | 38.6 | 2003-12-08T02:07:14.0 |
|
|
|
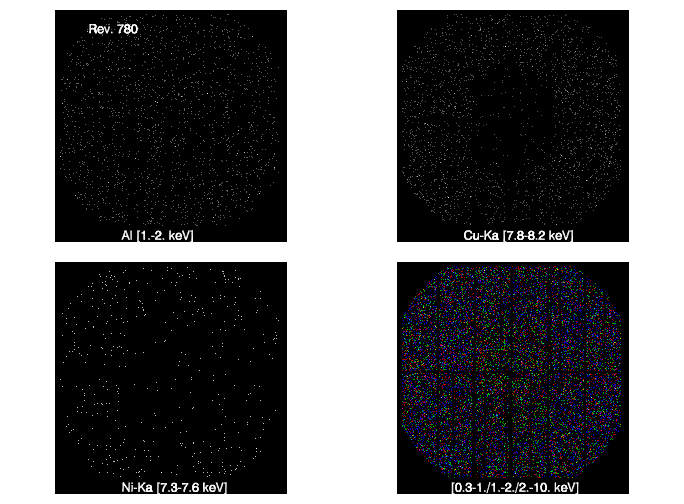
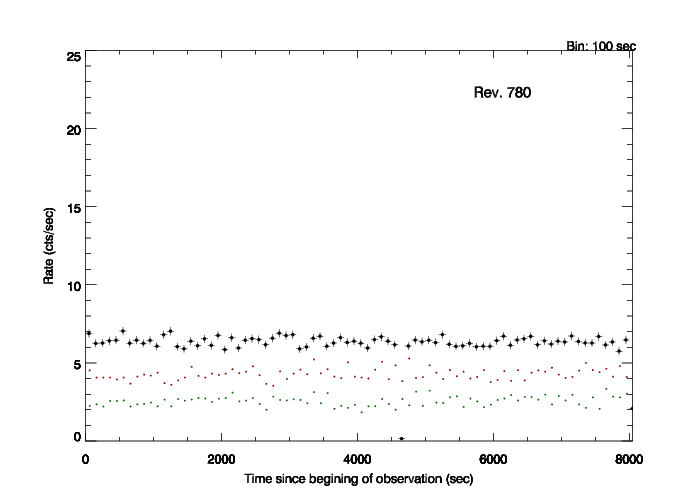
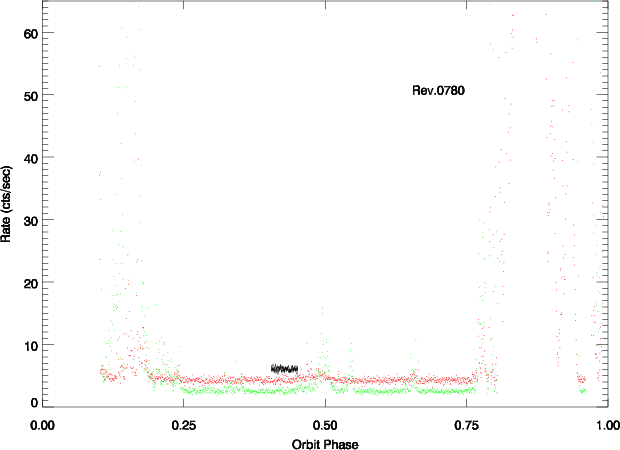
| 0780_0164160201_EPN_S003 | 8.0 | 2004-03-13T05:13:35.0 |
|
|
|
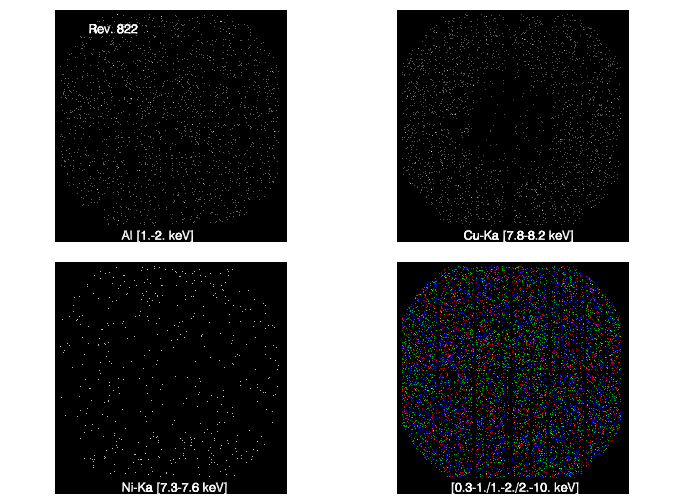
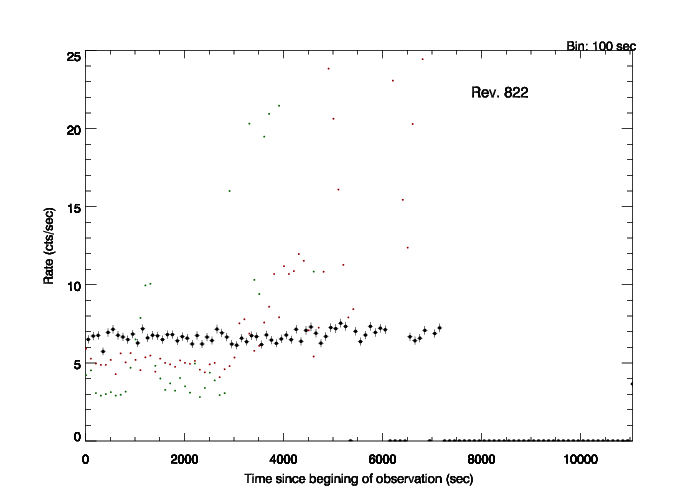
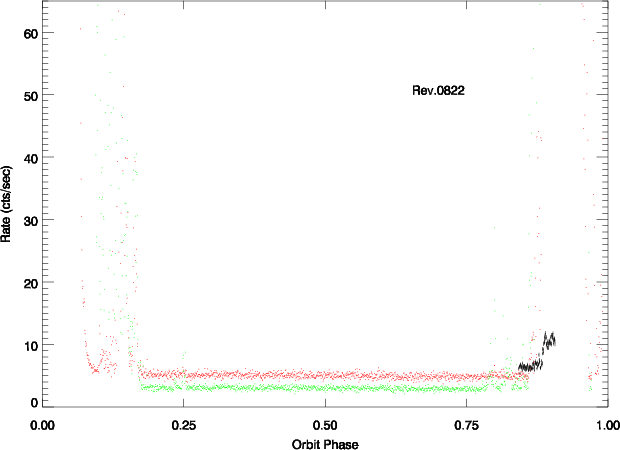
| 0822_0165160401_EPN_S003 | 11.0 | 2004-06-05T20:37:26.0 |
|
|
|
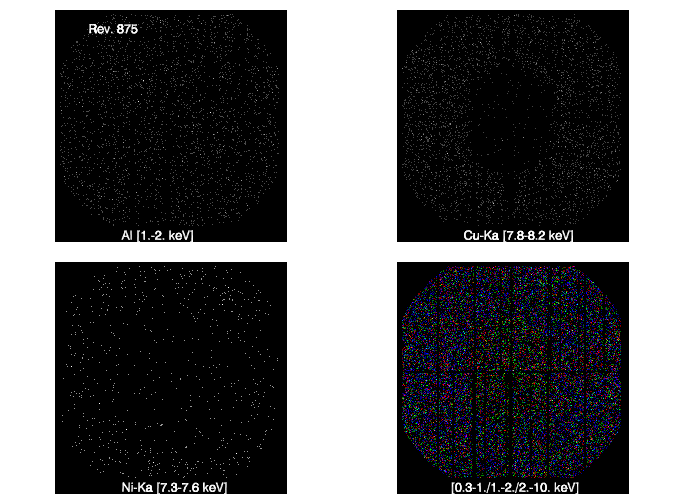
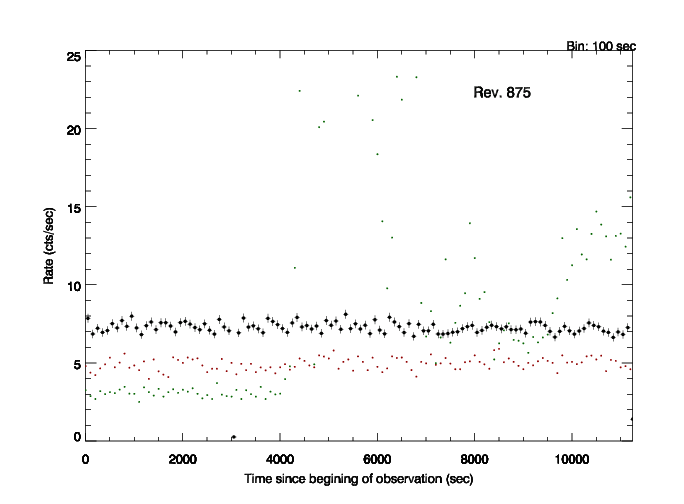
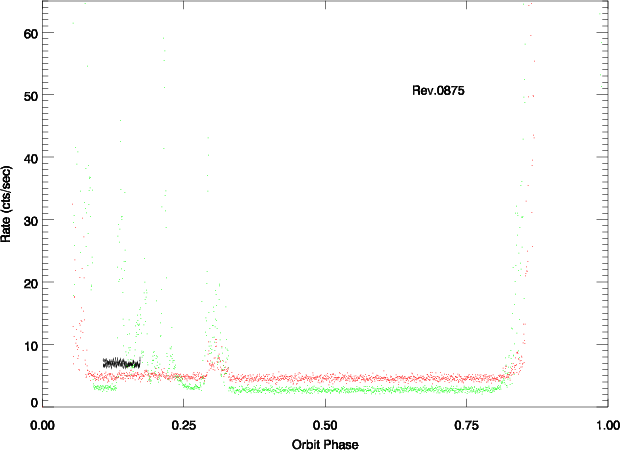
| 0875_0203850201_EPN_S011 | 11.2 | 2004-09-18T02:21:50.0 |
|
|
|
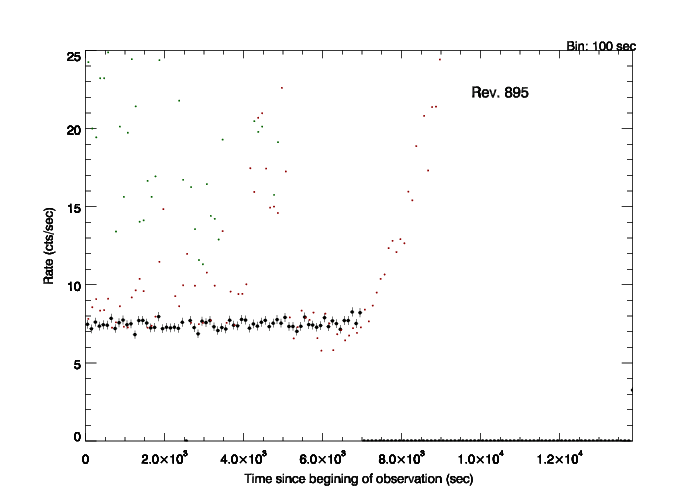
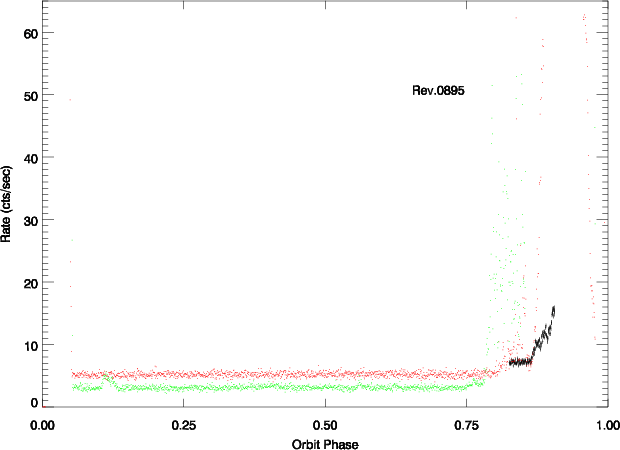
| 0895_0201901001_EPN_S010 | 13.8 | 2004-10-29T10:01:21.0 |

|
|
|
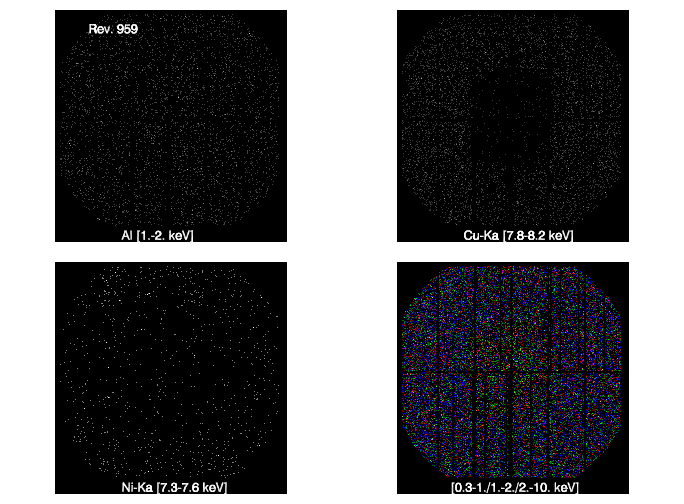
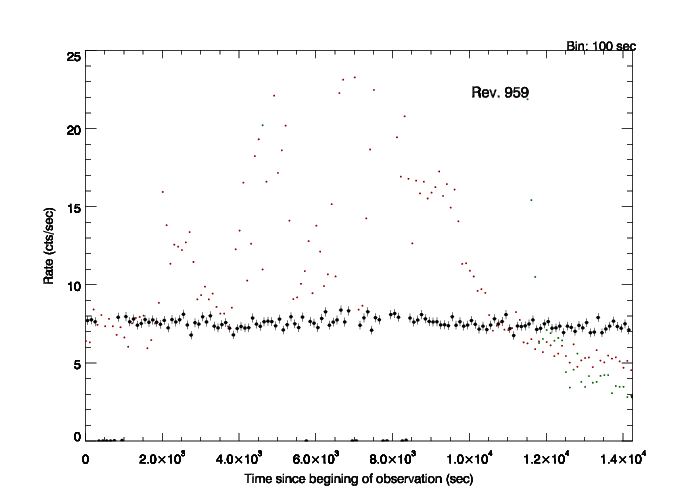
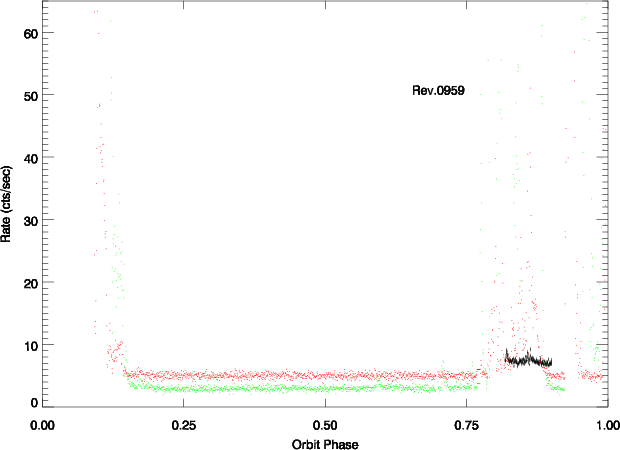
| 0959_0212282501_EPN_S014 | 14.2 | 2005-03-06T01:23:15.0 |
|
|
|
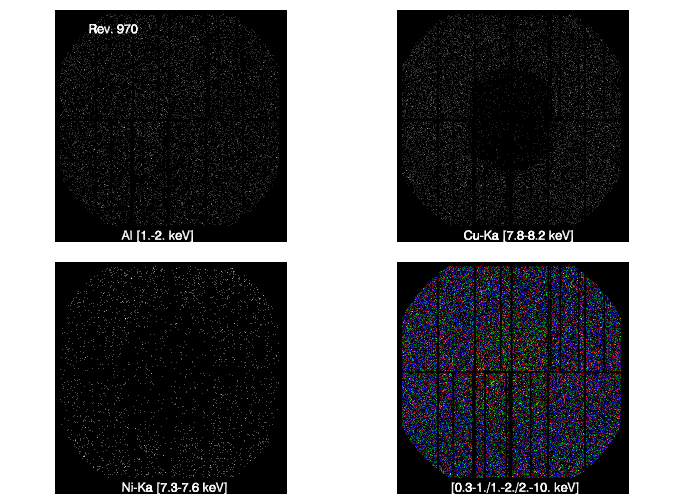
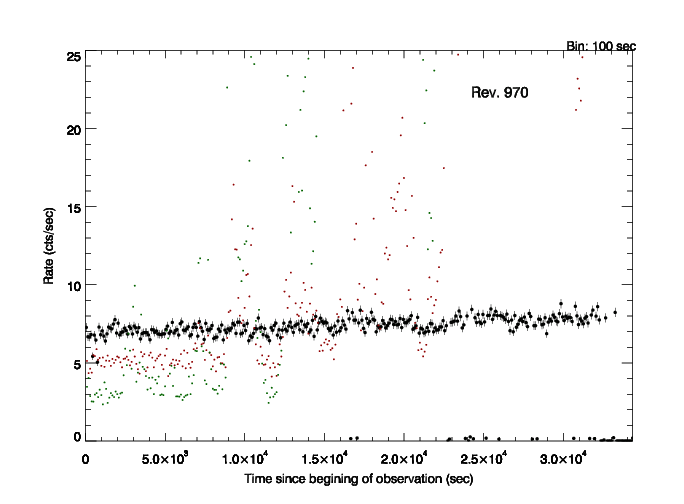
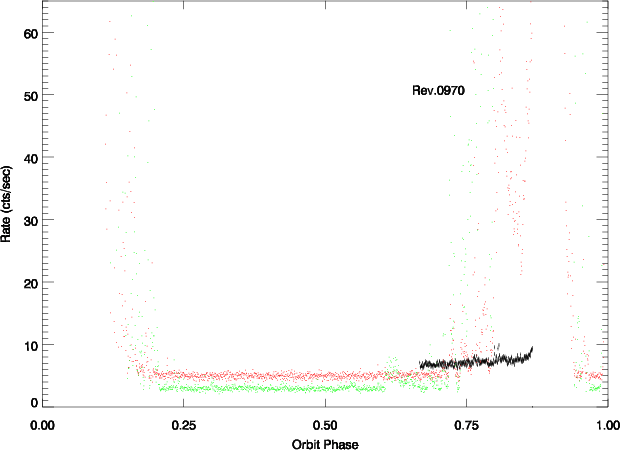
| 0970_0212282601_EPN_S003 | 34.4 | 2005-03-27T16:42:56.0 |
|
|
|
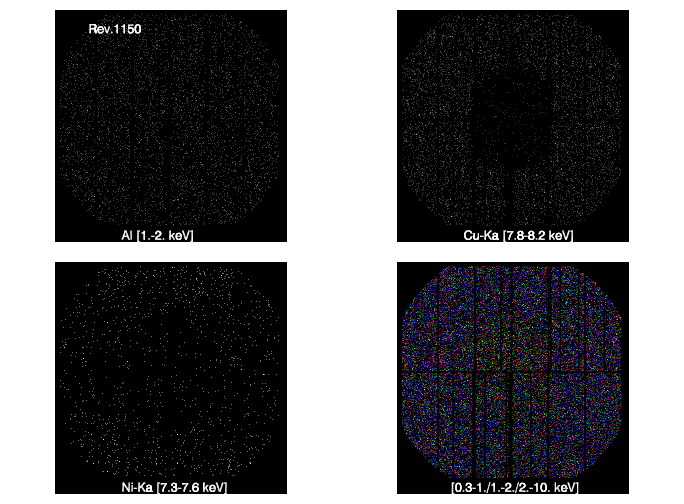
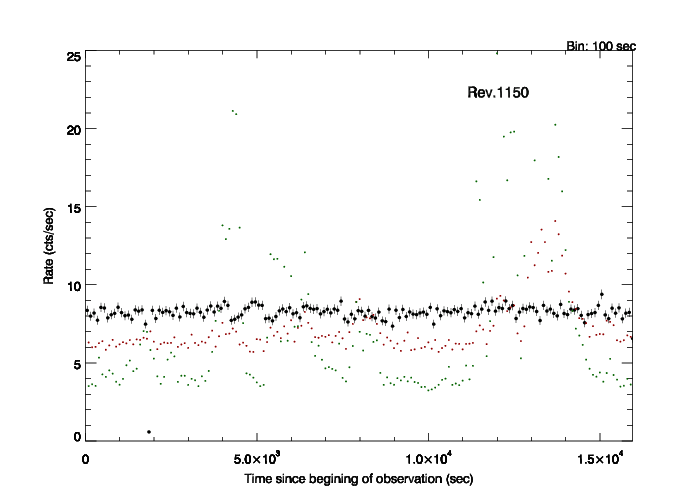
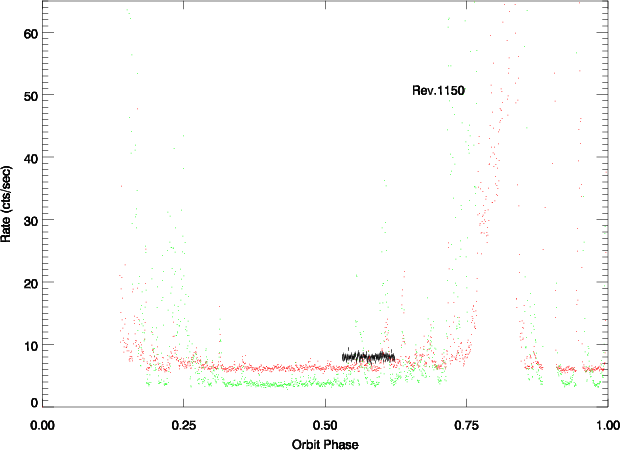
| 1150_0134722001_EPN_S025 | 16.0 | 2006-03-21T10:24:10.0 |
|
|
|
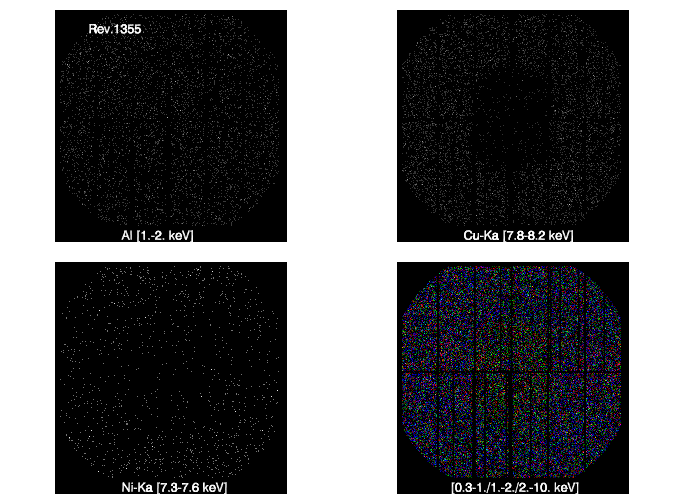
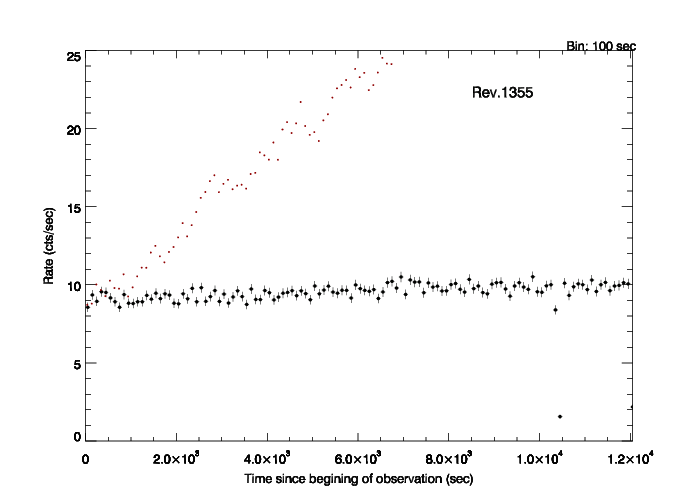
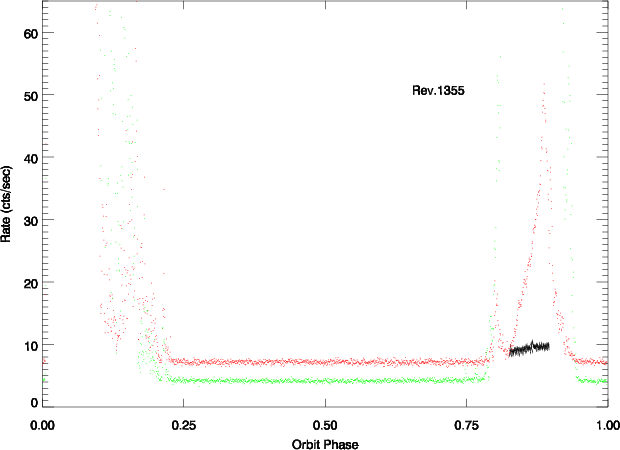
| 1355_0413580201_EPN_S008 | 12.0 | 2007-05-04T21:07:29.0 |
|
|
|
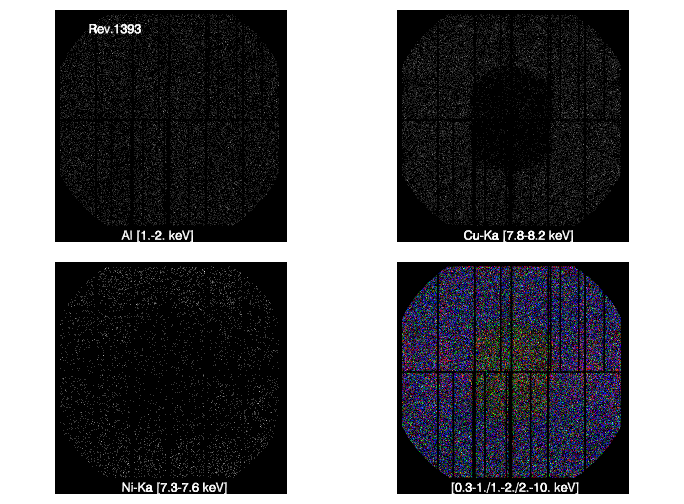
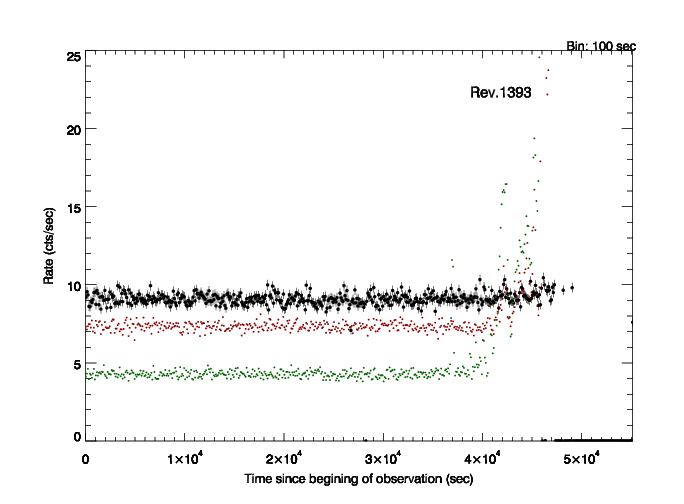
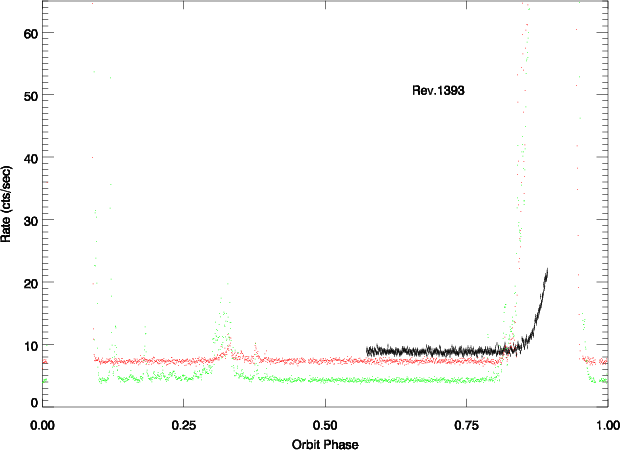
| 1393_0412580201_EPN_S003 | 55.1 | 2007-07-19T04:00:32.0 |
|
|
|
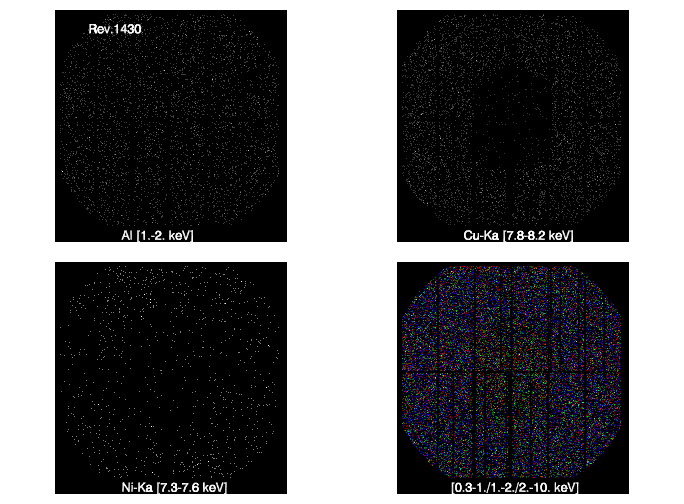
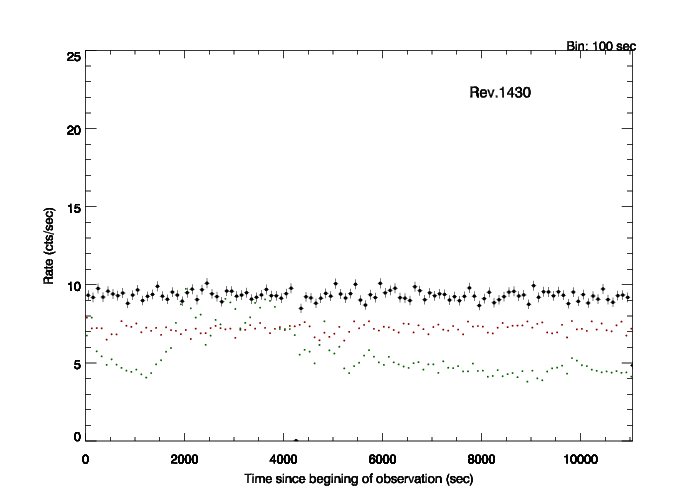
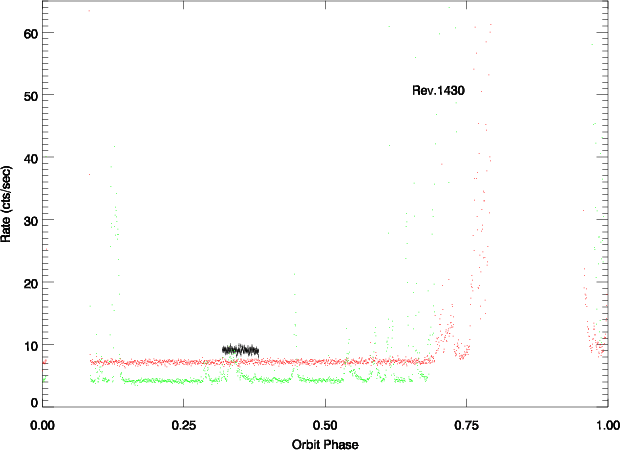
| 1430_0511010401_EPN_S003 | 11.1 | 2007-09-30T10:49:40.0 |
|
|
|
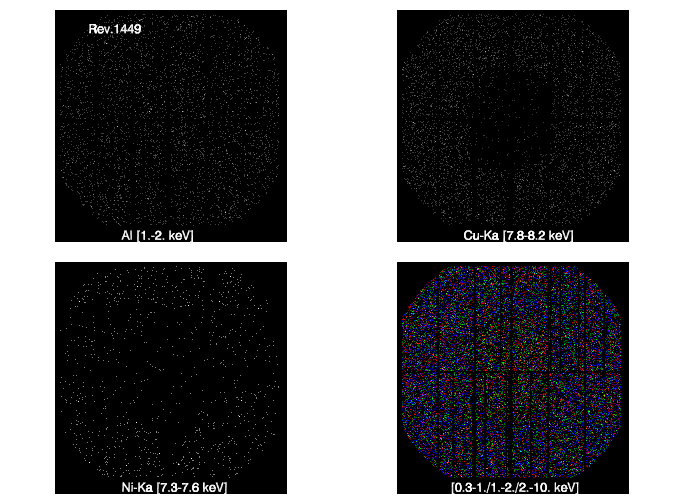
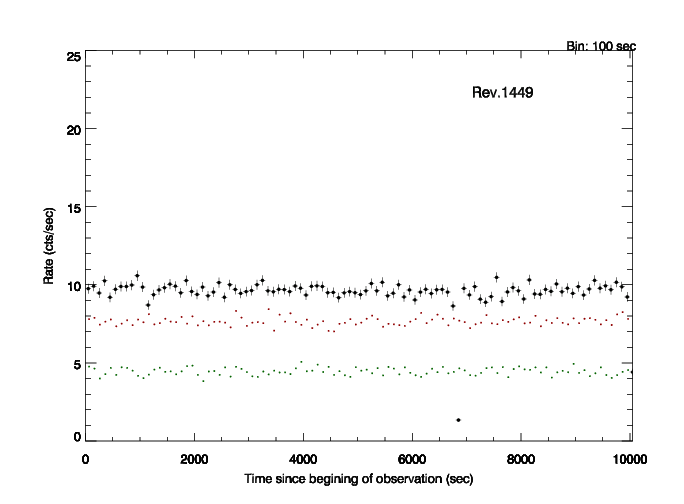
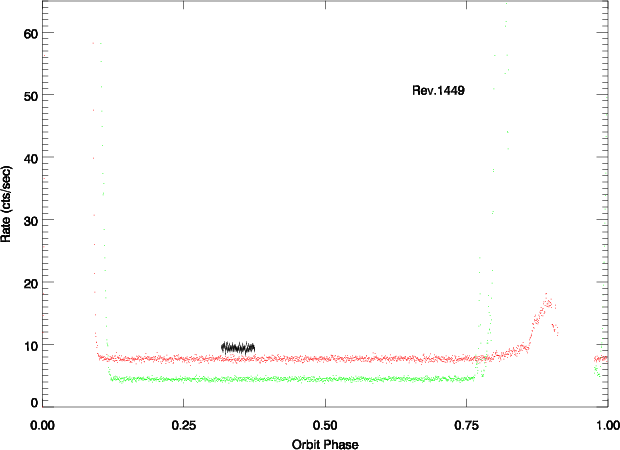
| 1449_0502041701_EPN_S003 | 10.1 | 2007-11-07T08:09:56.0 |
|
|
|
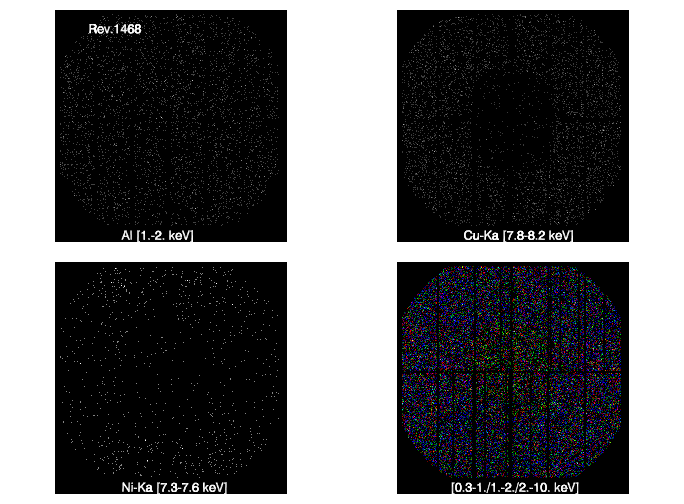
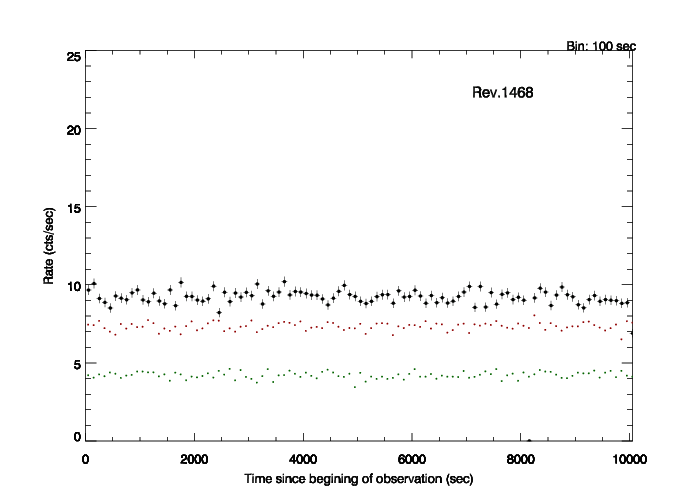
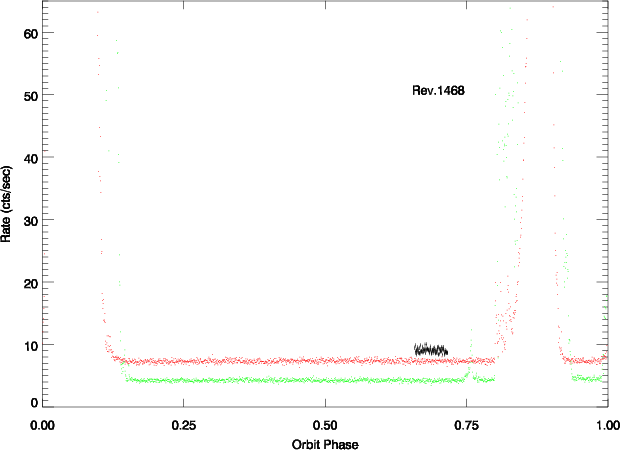
| 1468_0504102401_EPN_S004 | 10.1 | 2007-12-15T22:00:38.0 |
|
|
|
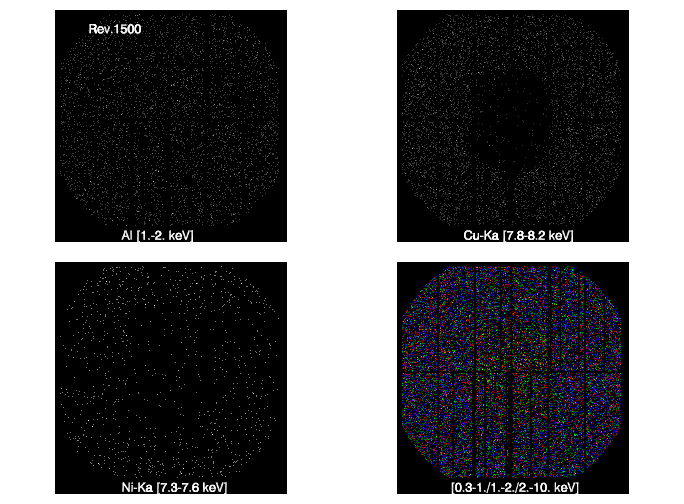
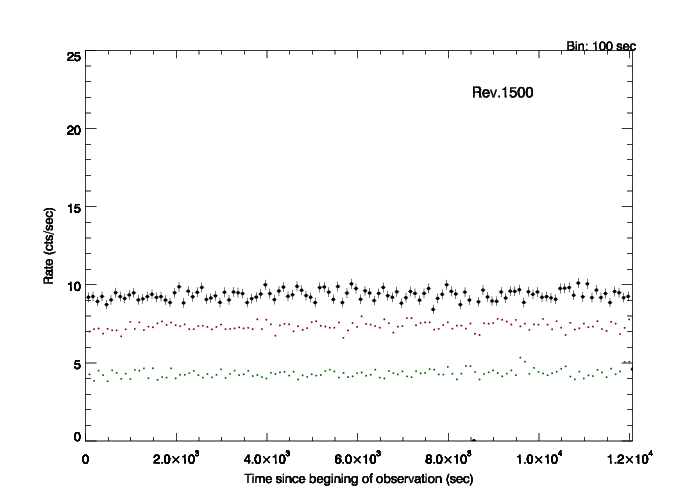
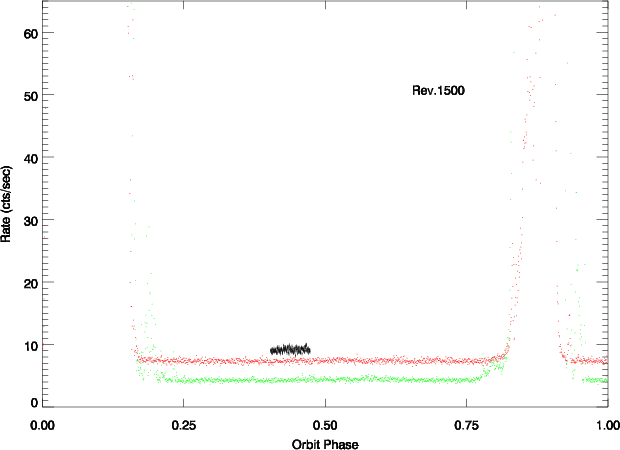
| 1500_0511011001_EPN_S003 | 12.1 | 2008-02-17T05:28:14.0 |
|
|
|
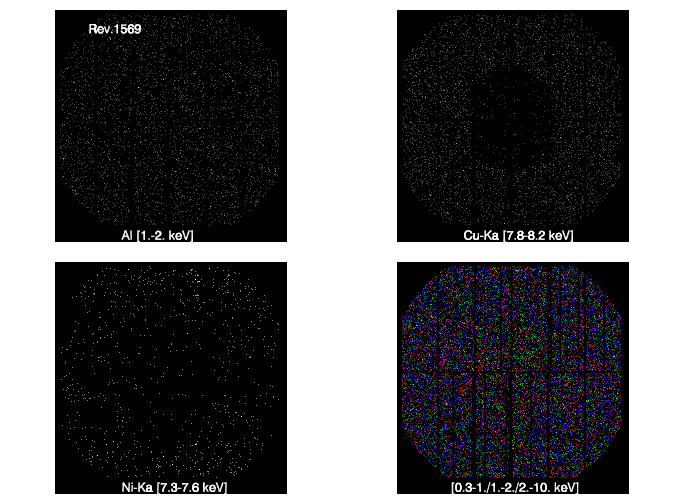
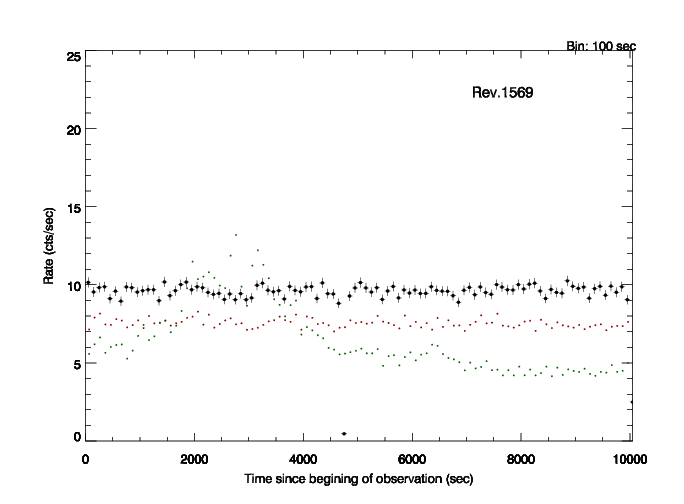
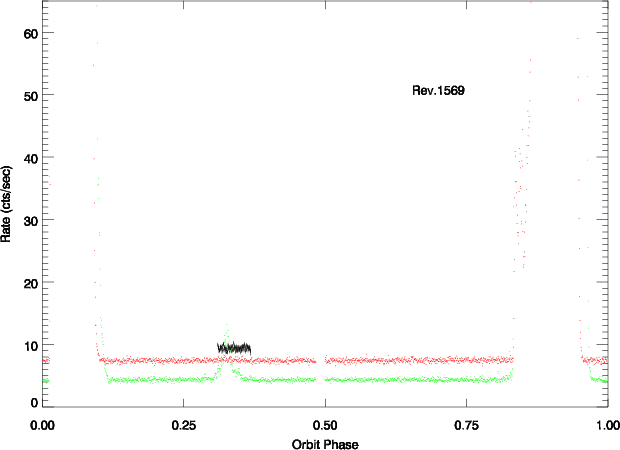
| 1569_0553912001_EPN_S003 | 10.0 | 2008-07-03T15:42:18.0 |
|
|
|
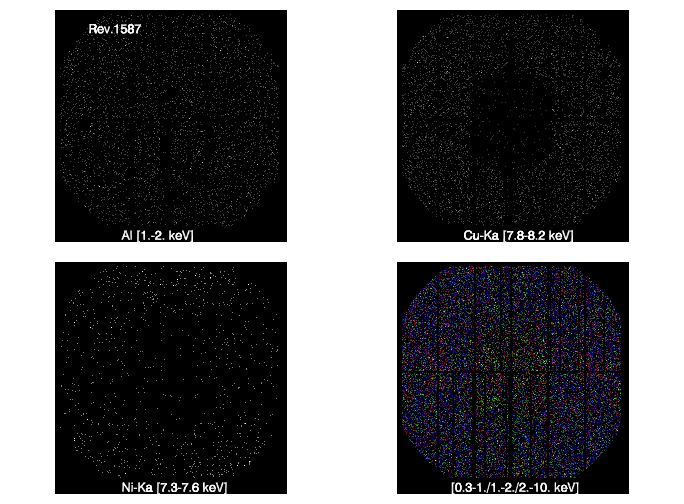
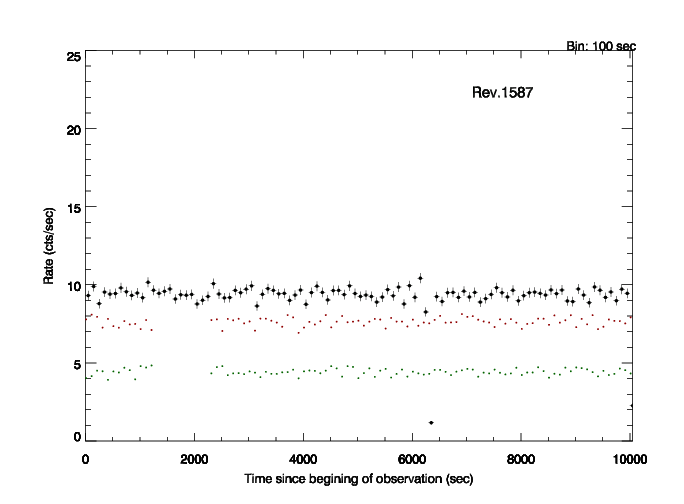
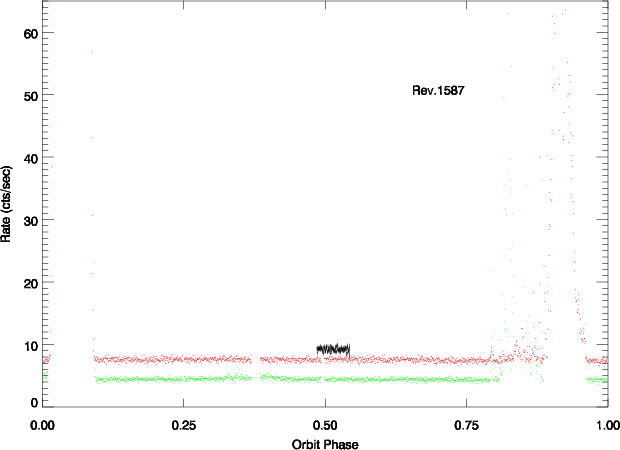
| 1587_0556214601_EPN_S003 | 10.0 | 2008-08-08T21:40:38.0 |
|
|
|
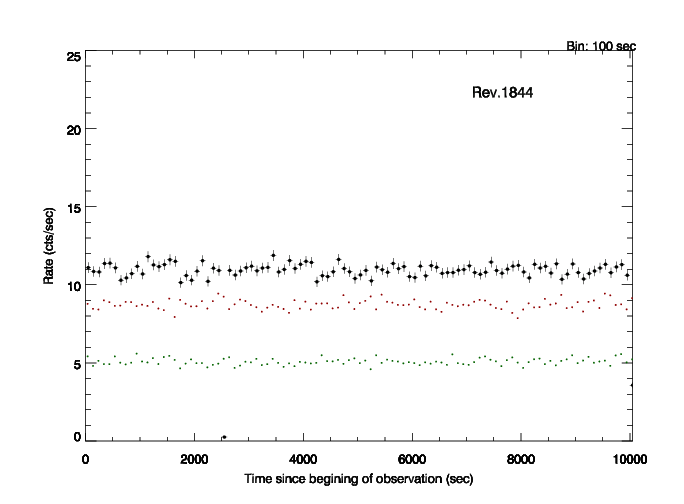
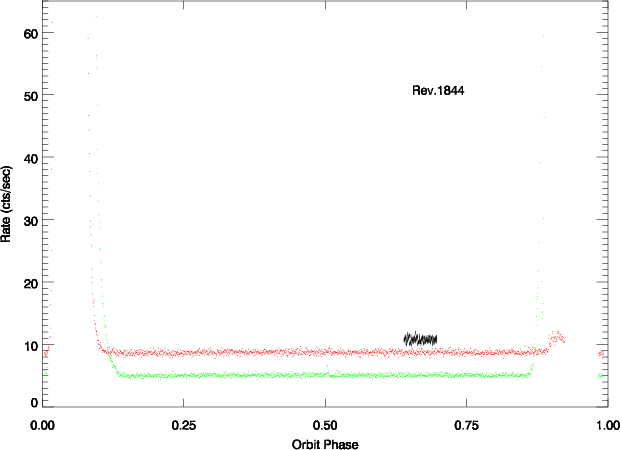
| 1844_0604890201_EPN_S003 | 10.0 | 2010-01-03T17:59:25.0 |

|
|
|
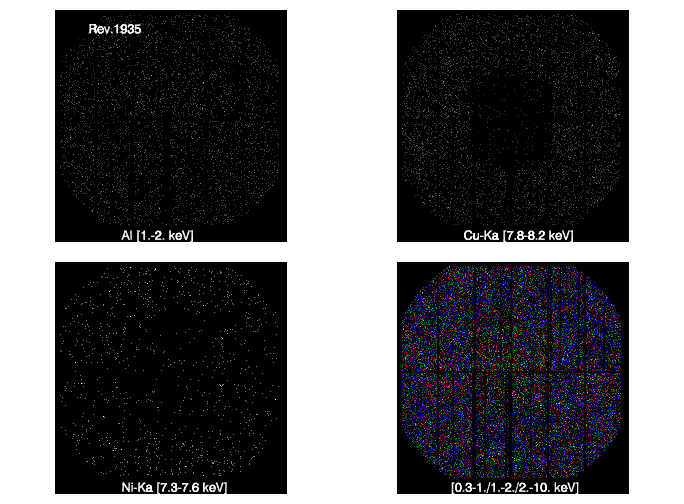
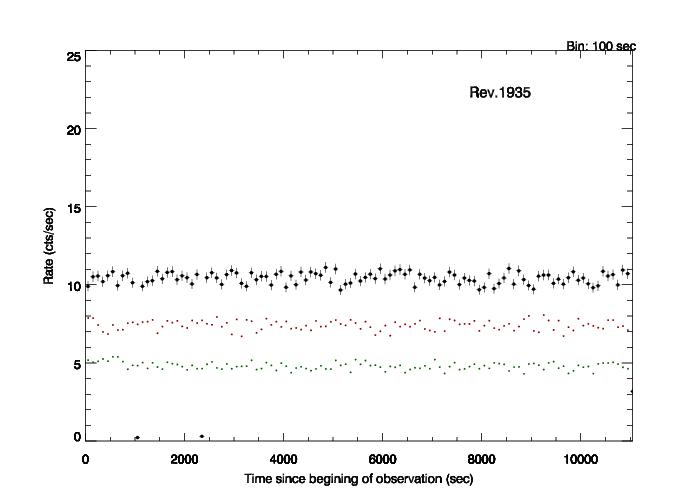
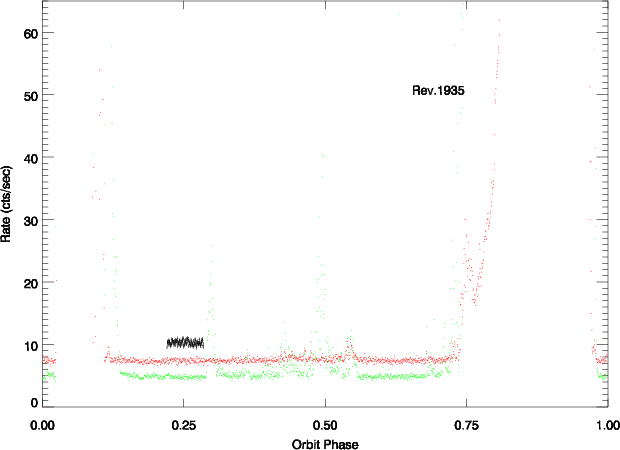
| 1935_0653870701_EPN_S003 | 11.0 | 2010-07-03T09:02:52.0 |
|
|
|
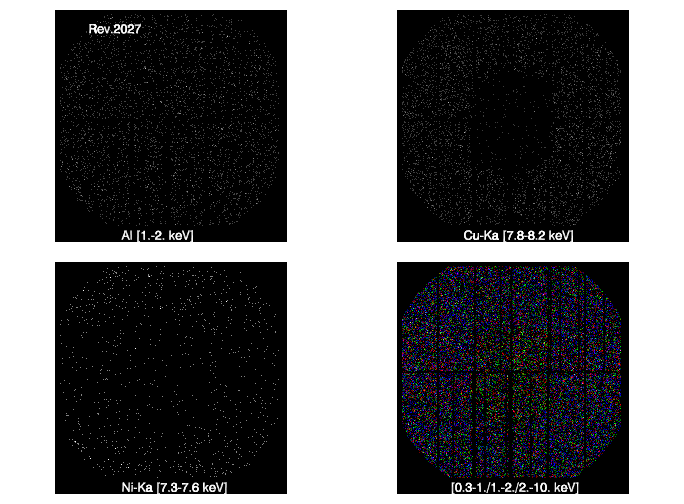
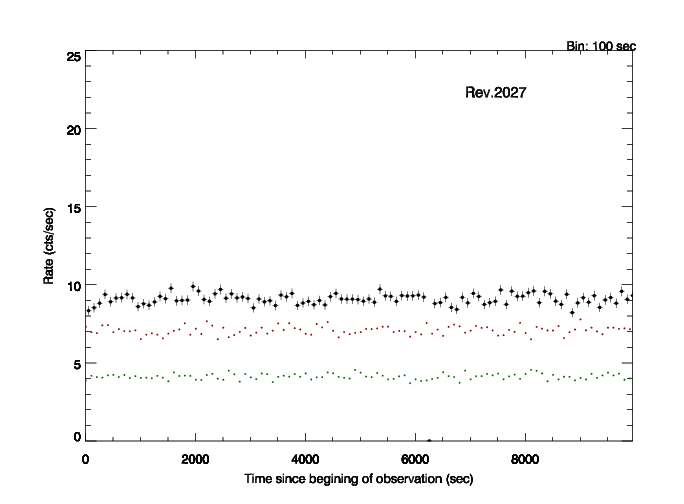
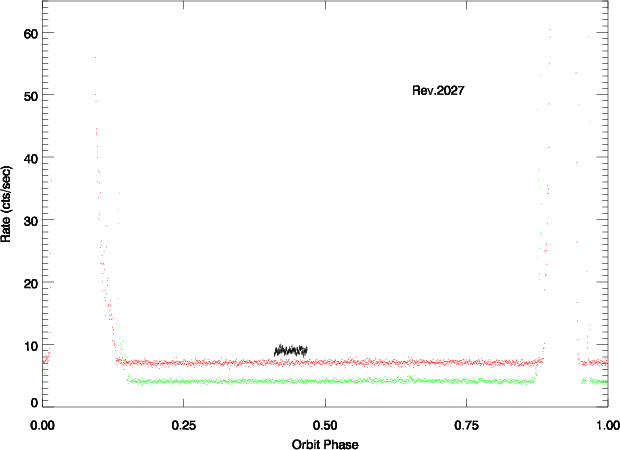
| 2027_0412580701_EPN_S018 | 10.0 | 2011-01-03T05:38:14.0 |
|
|
|
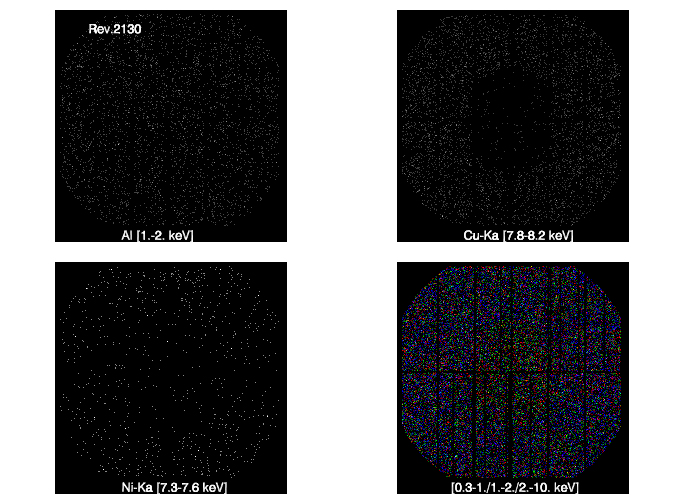
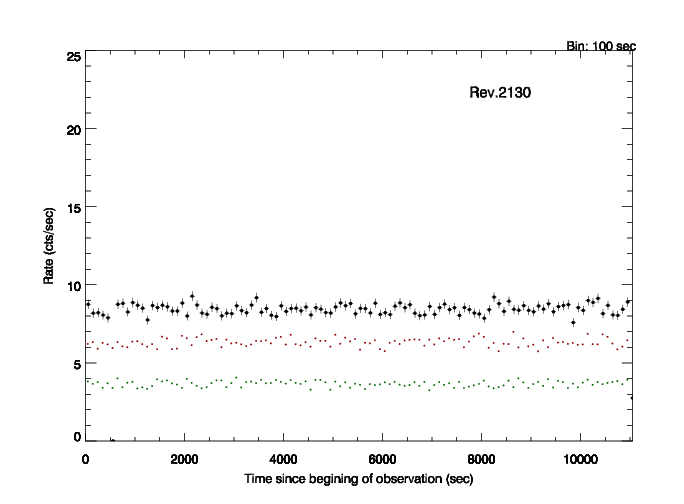
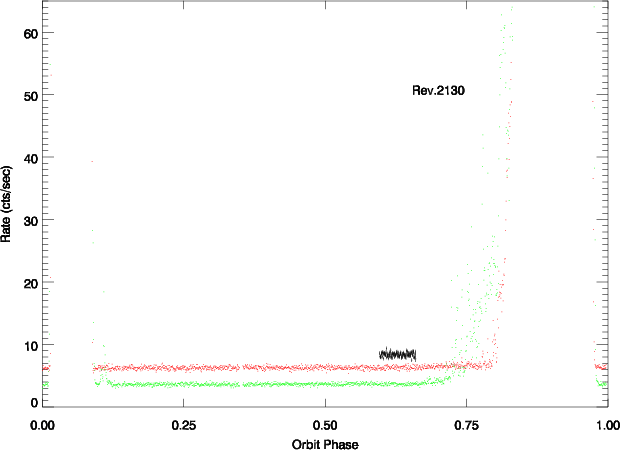
| 2130_0677182401_EPN_S003 | 11.0 | 2011-07-28T00:37:24.0 |
|
|
|
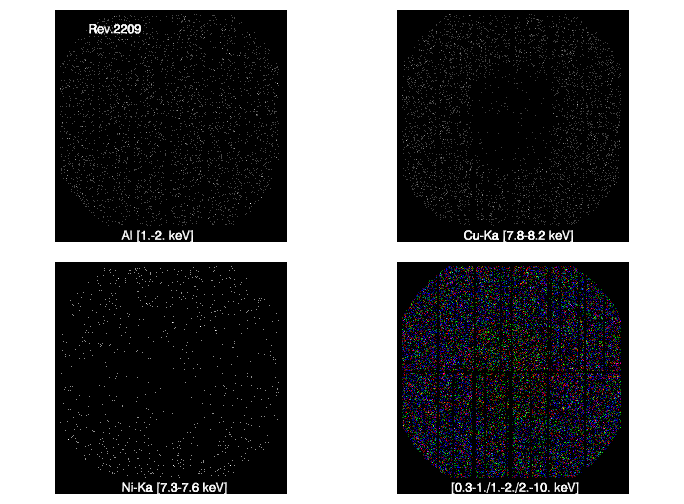
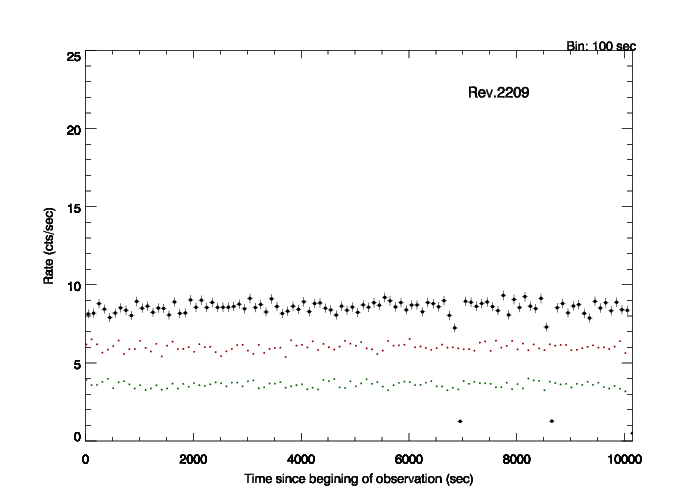
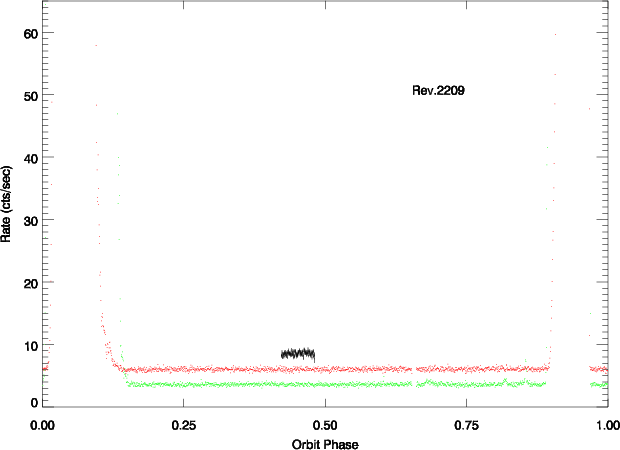
| 2209_0412580801_EPN_S016 | 10.1 | 2012-01-01T05:37:22.0 |
|
|
|
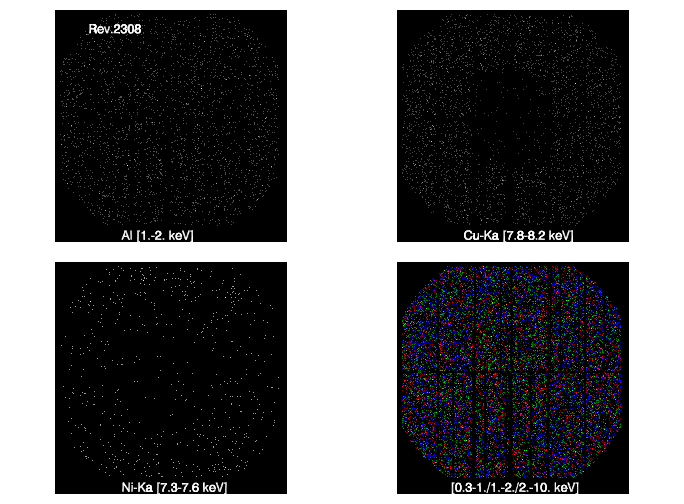
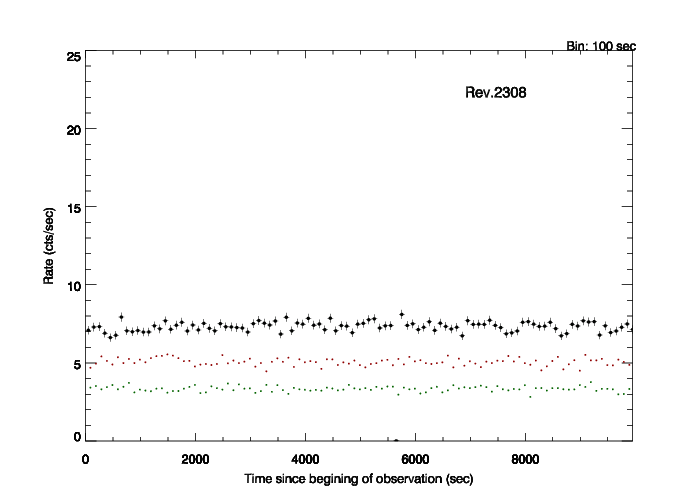
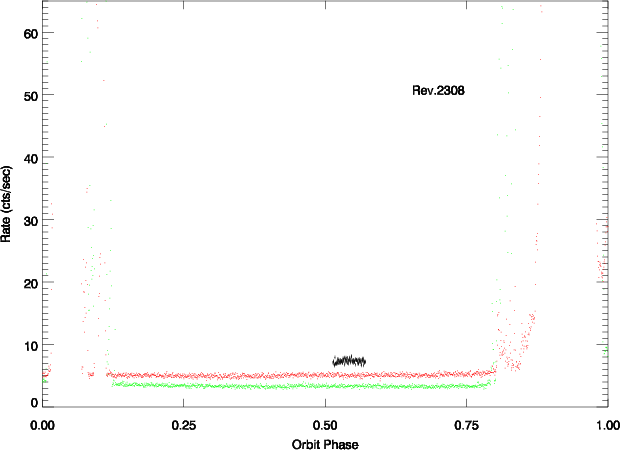
| 2308_0414191001_EPN_S022 | 10.0 | 2012-07-16T19:53:04.0 |
|
|
|
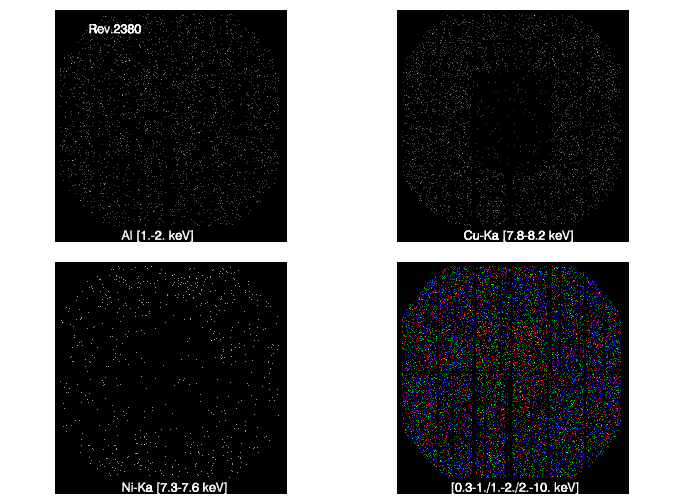
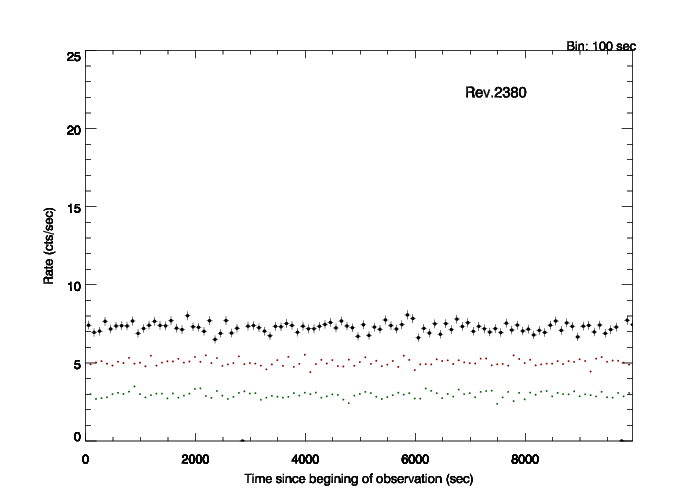
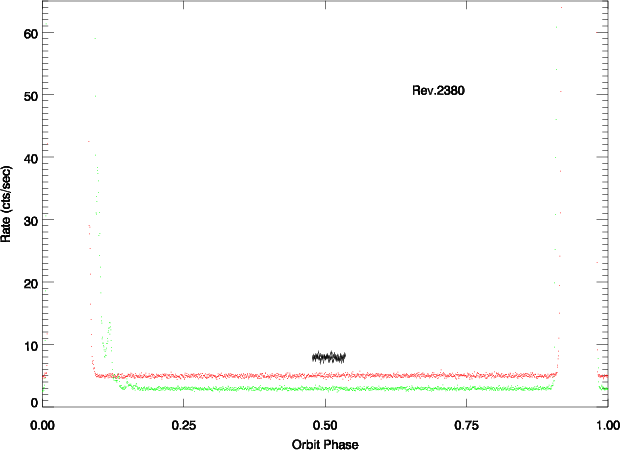
| 2380_0412981701_EPN_S022 | 10.0 | 2012-12-07T08:36:53.0 |
|
|
|
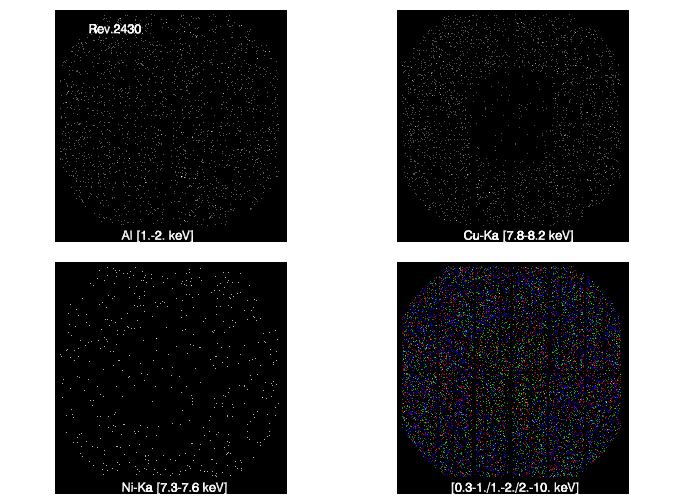
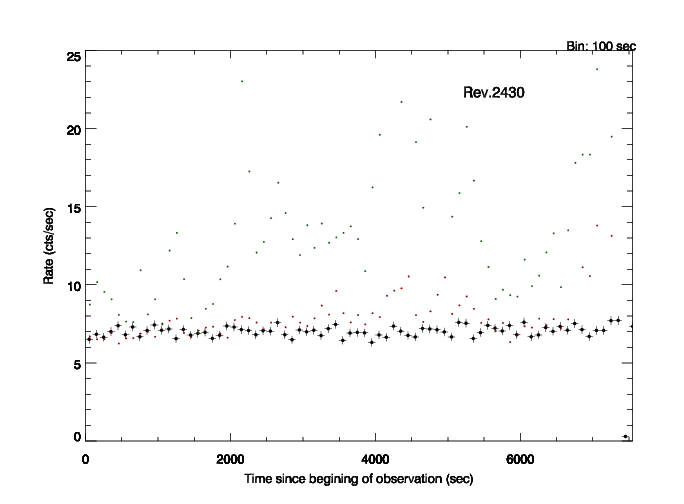
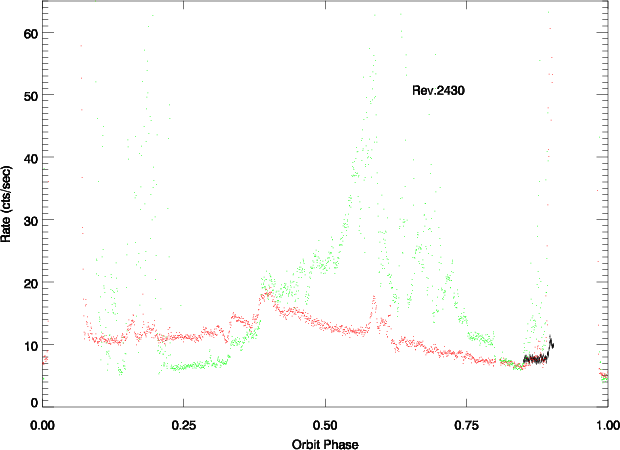
| 2430_0727360101_EPN_U002 | 9.2 | 2013-03-17T19:31:39.0 |
|
|
|
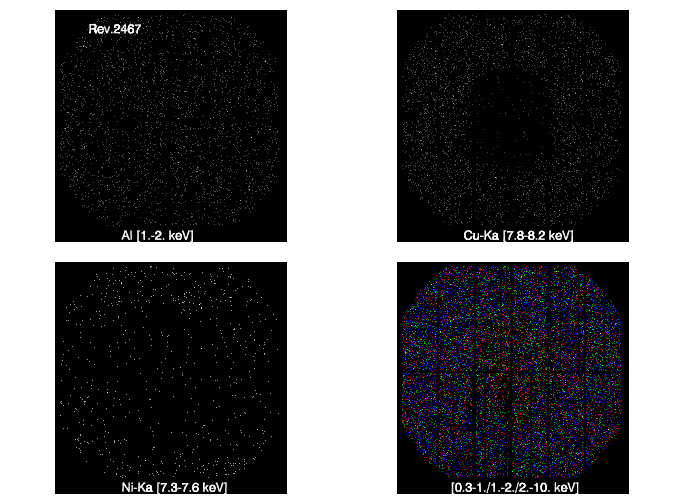
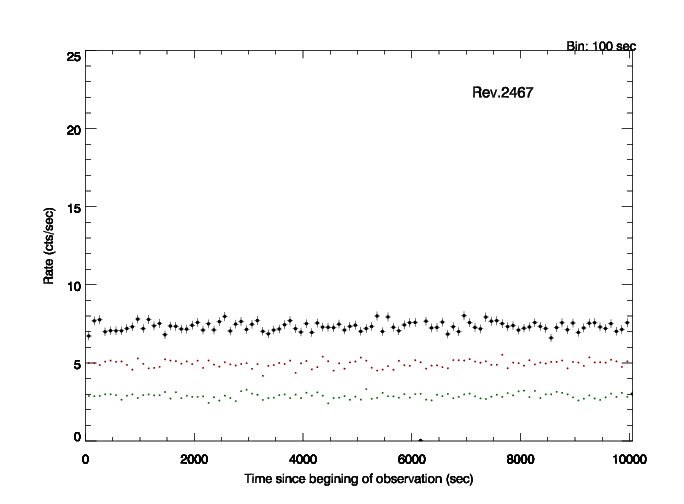
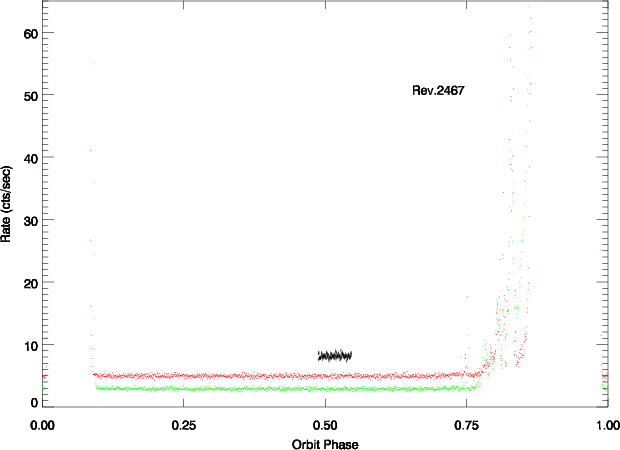
| 2467_0720880201_EPN_S003 | 10.0 | 2013-05-29T21:10:00.0 |
|
|
|
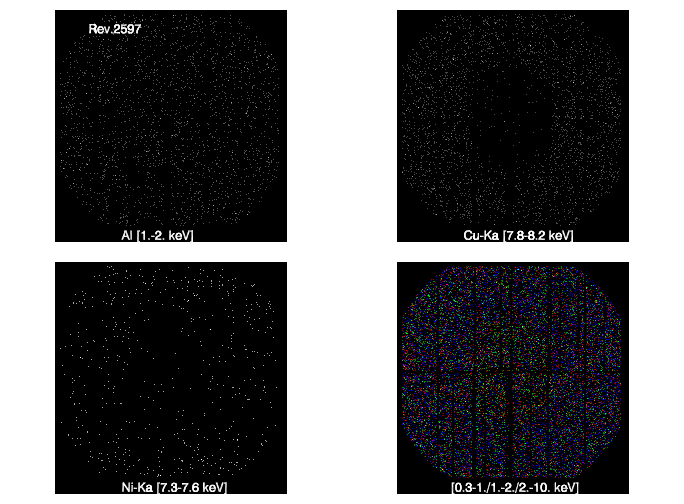
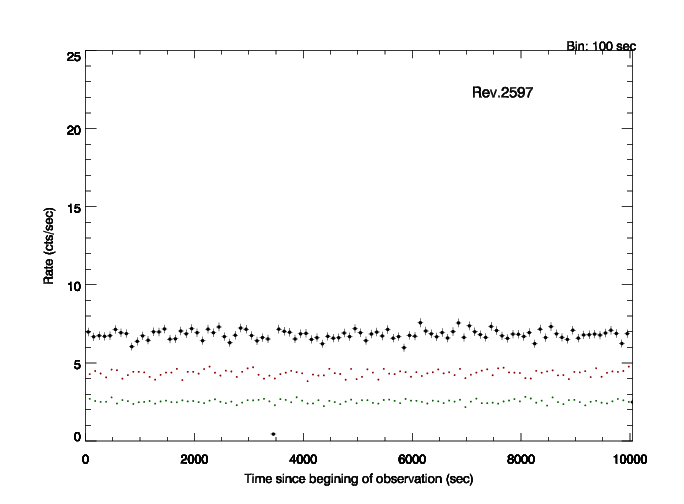
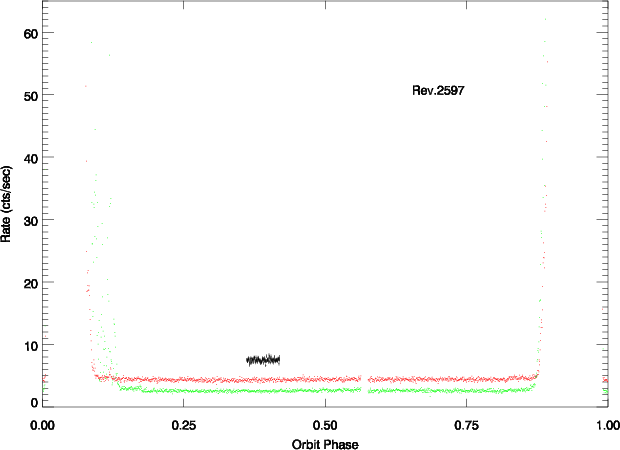
| 2597_0723130501_EPN_S003 | 10.0 | 2014-02-12T21:27:19.0 |
|
|
|
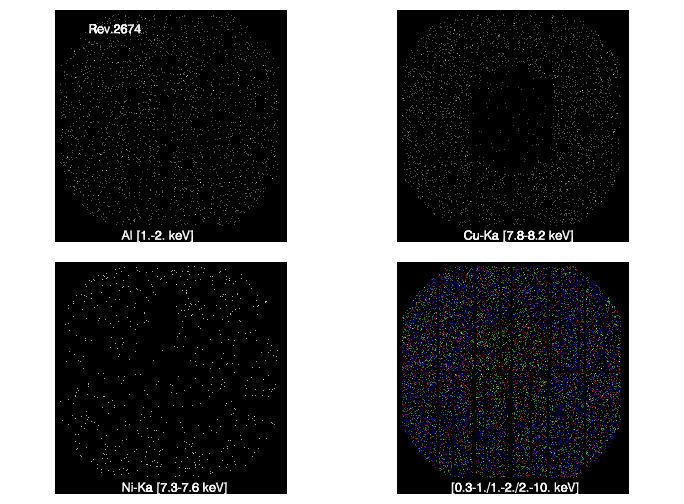
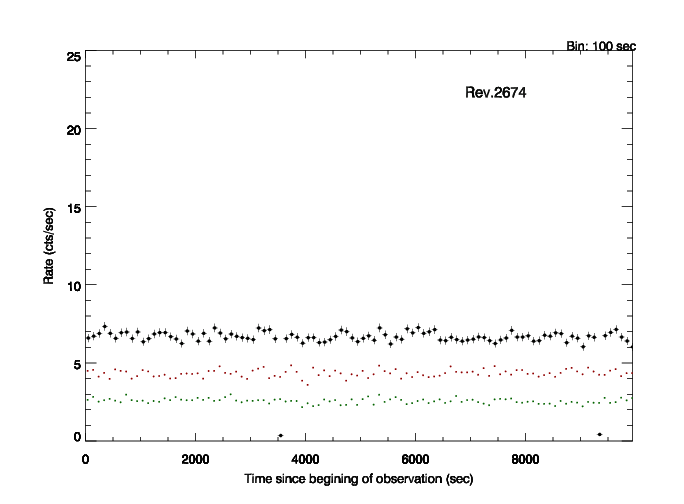
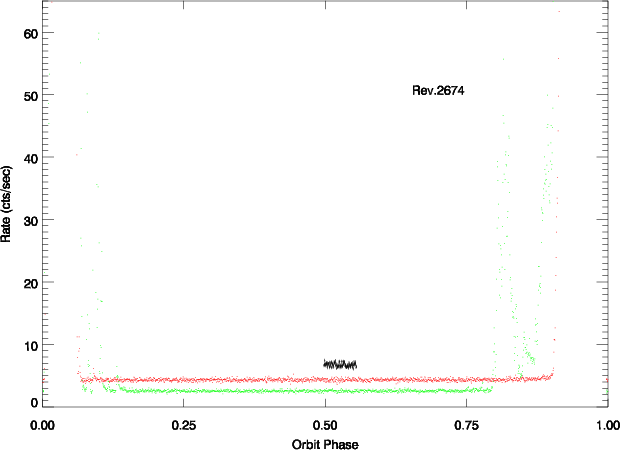
| 2674_0744450401_EPN_S011 | 10.0 | 2014-07-16T17:36:57.0 |
|
|
|
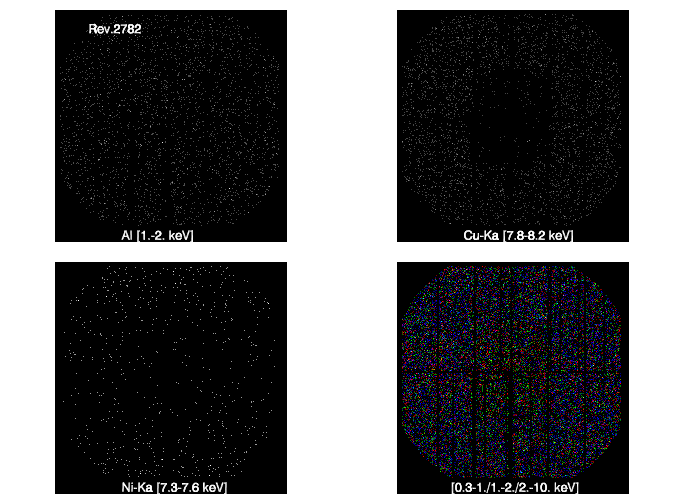
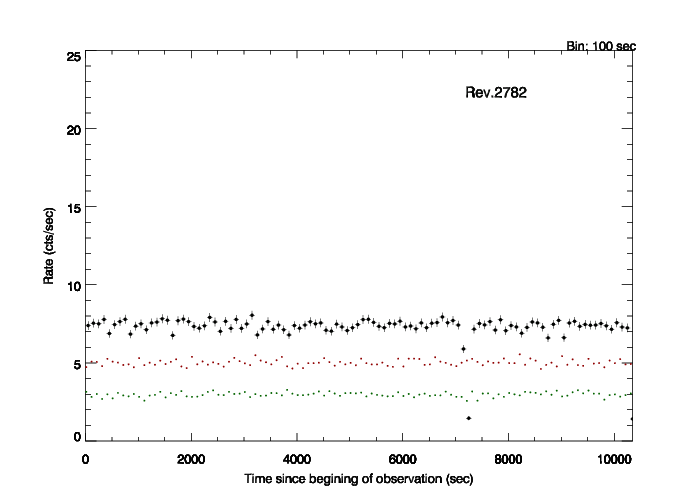
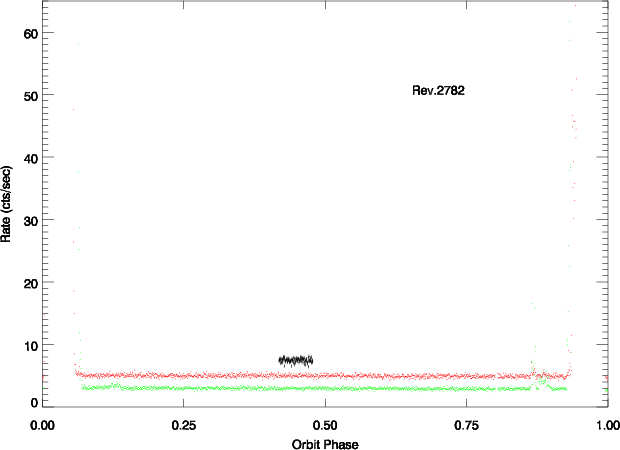
| 2782_0761921301_EPN_S001 | 10.3 | 2015-02-16T22:44:57.0 |
|
|
|
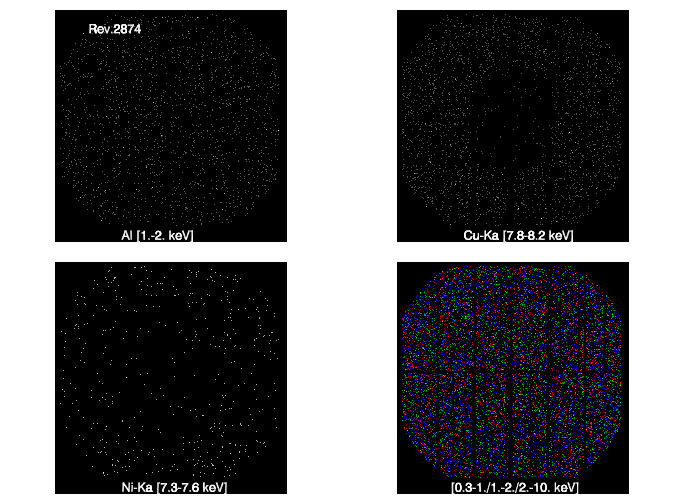
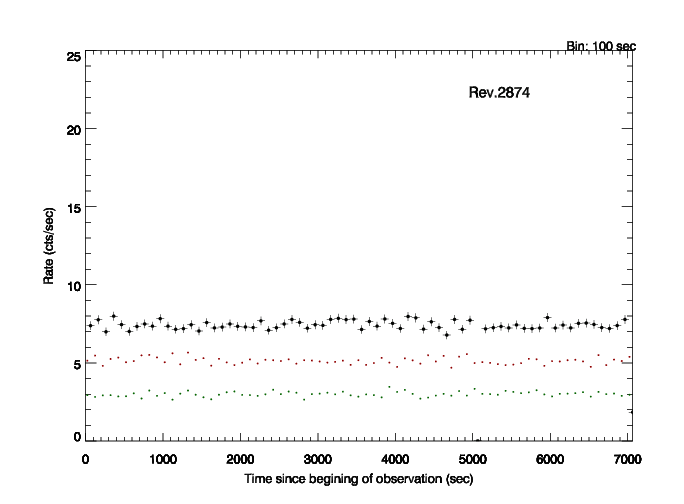
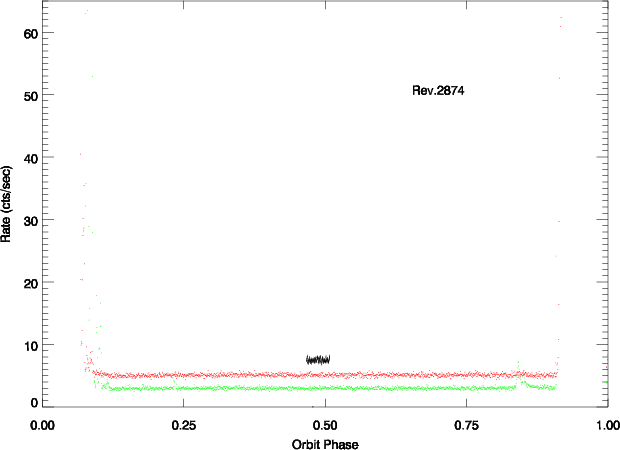
| 2874_0764060301_EPN_S003 | 7.0 | 2015-08-19T12:47:08.0 |
|
|
|
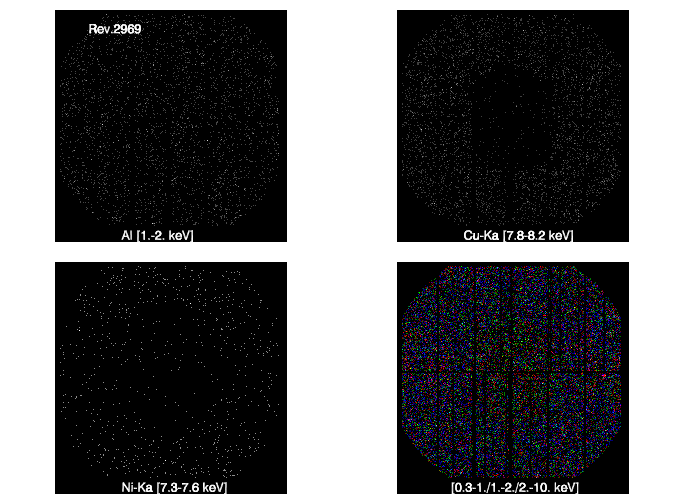
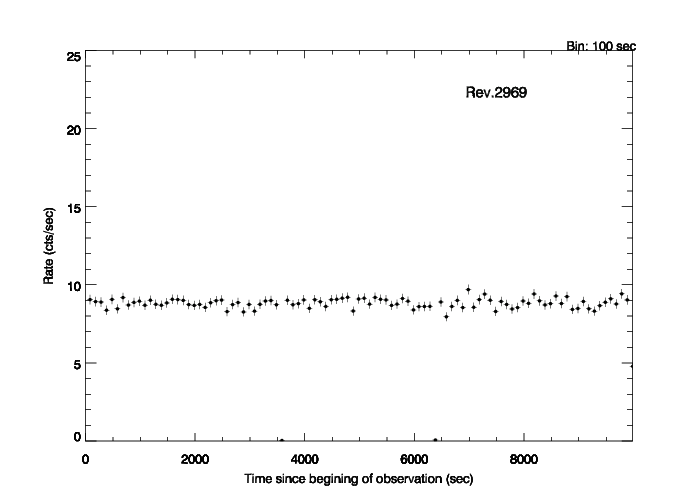
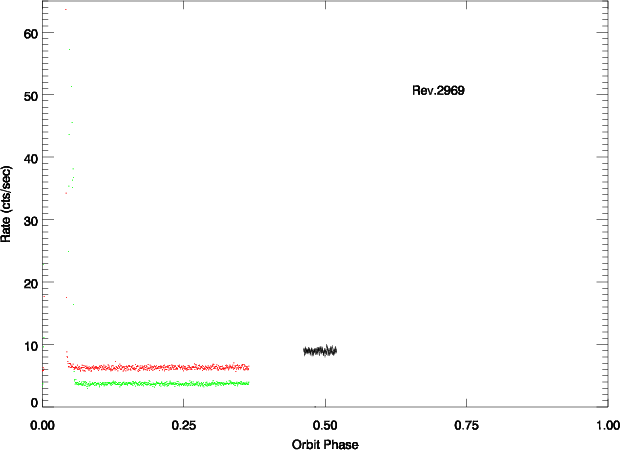
| 2969_0611183001_EPN_S011 | 10.0 | 2016-02-24T23:31:42.0 |
|
|
|
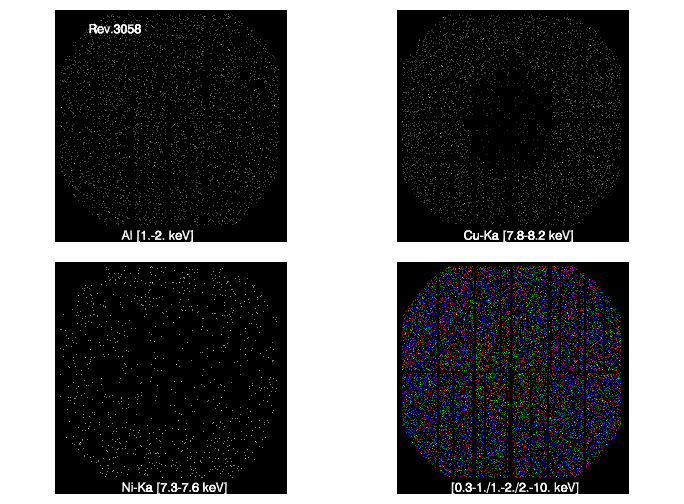
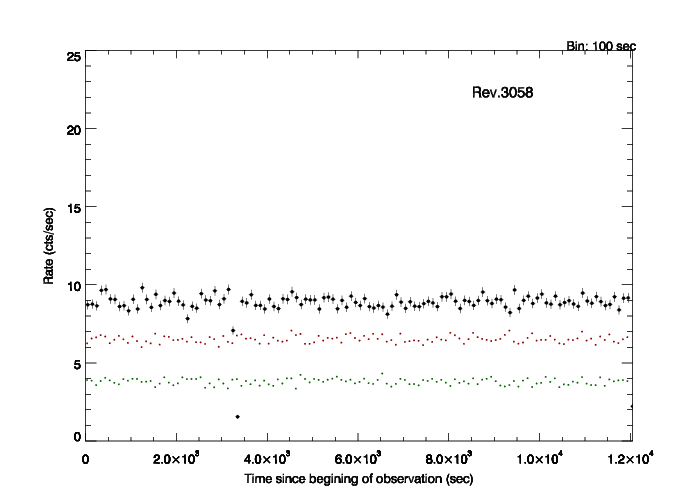
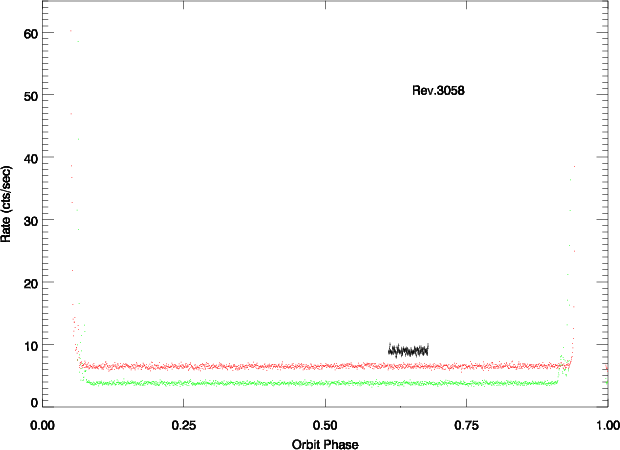
| 3058_0727571801_EPN_S003 | 12.0 | 2016-08-20T18:37:30.0 |
|
|
|
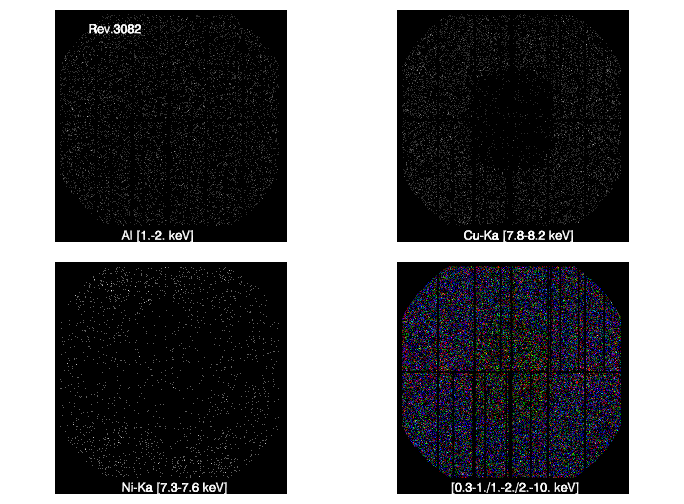
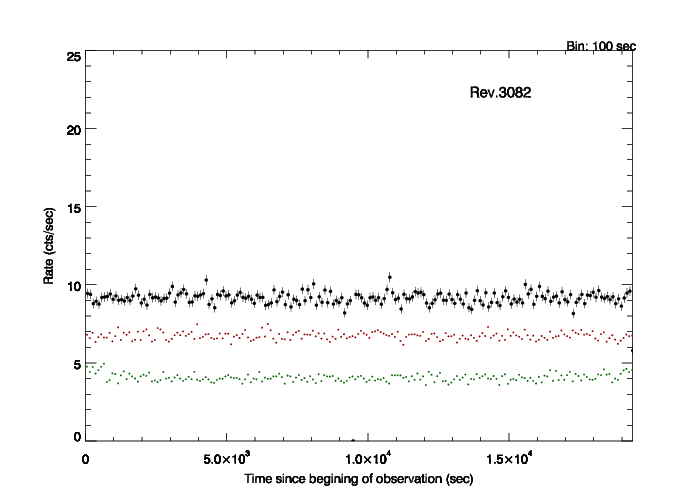
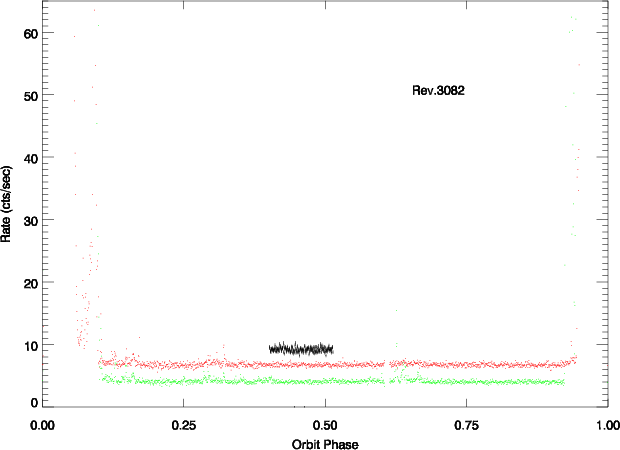
| 3082_0791980101_EPN_S002 | 19.4 | 2016-10-07T05:15:04.0 |
|
|
|
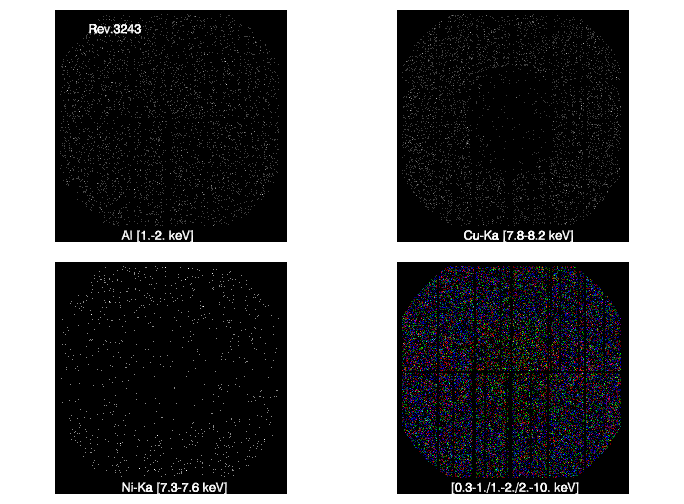
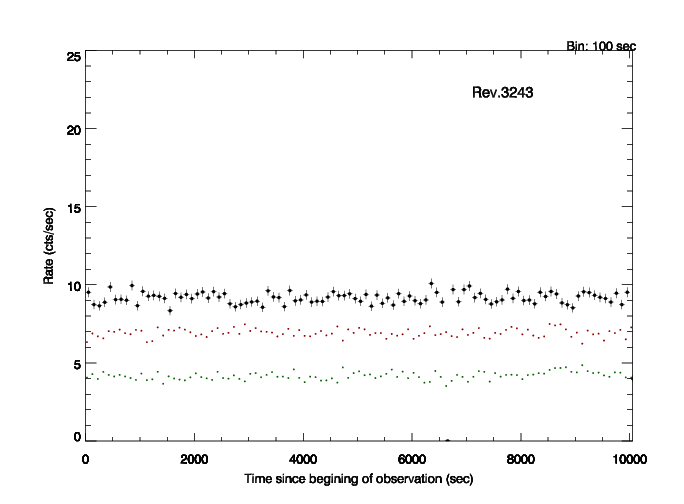
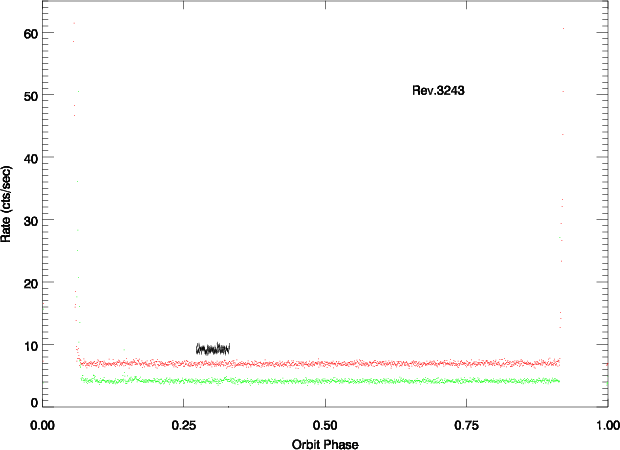
| 3243_0801010601_EPN_S003 | 10.0 | 2017-08-24T00:43:44.0 |
|
|
|
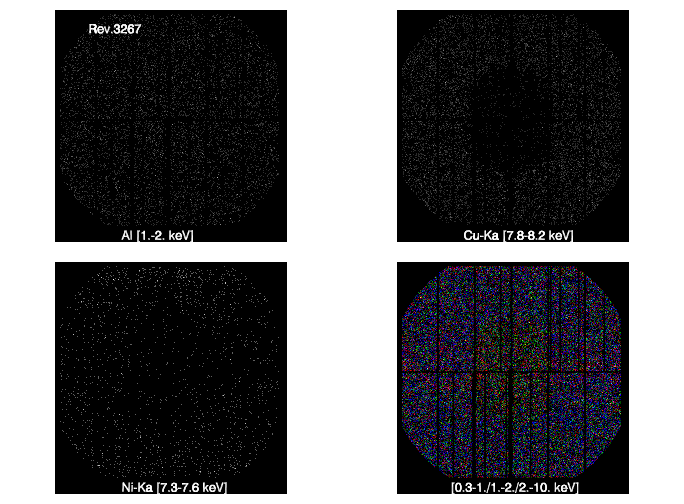
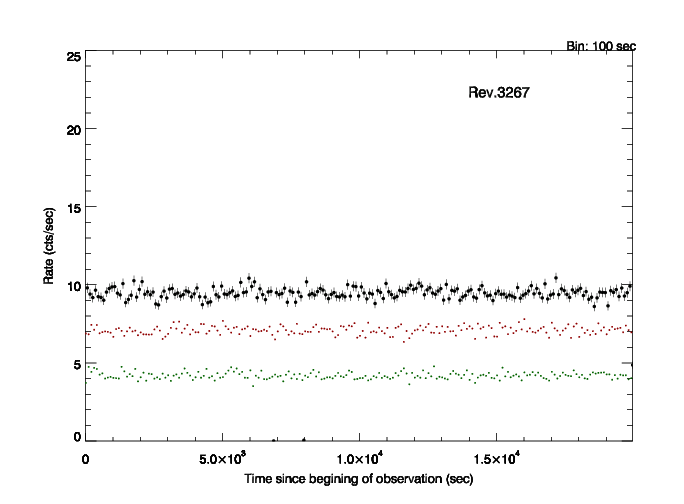
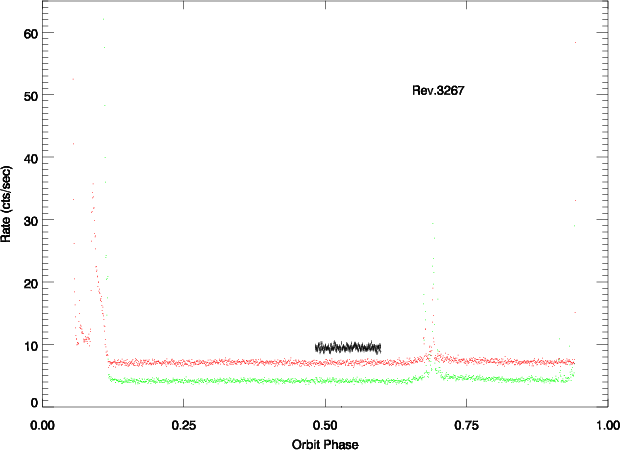
| 3267_0791980401_EPN_S002 | 20.0 | 2017-10-11T07:23:55.0 |
|
|
|
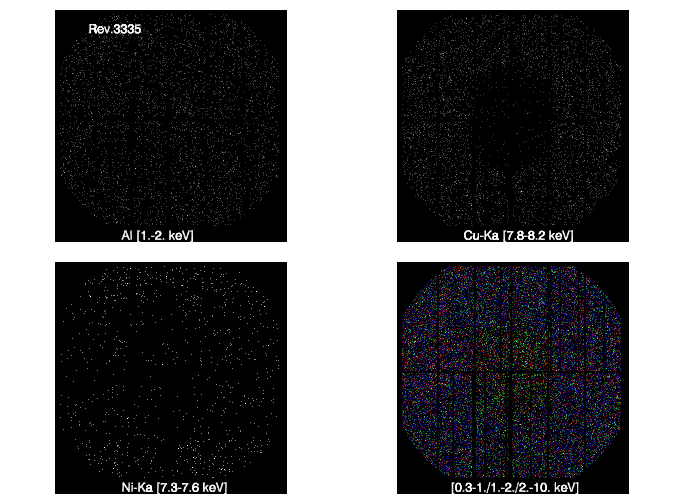
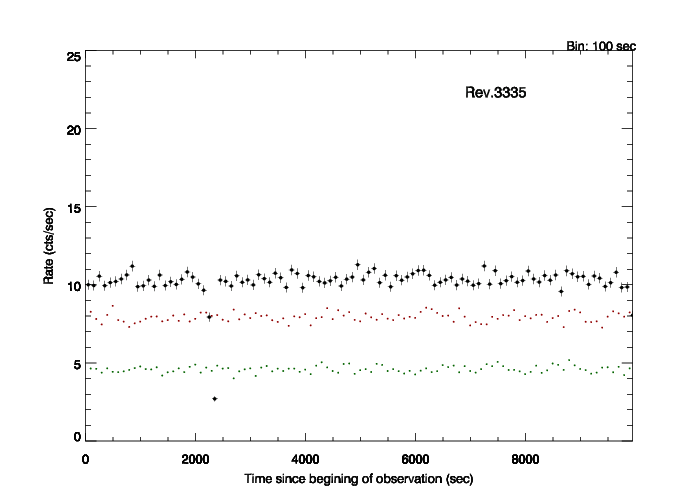
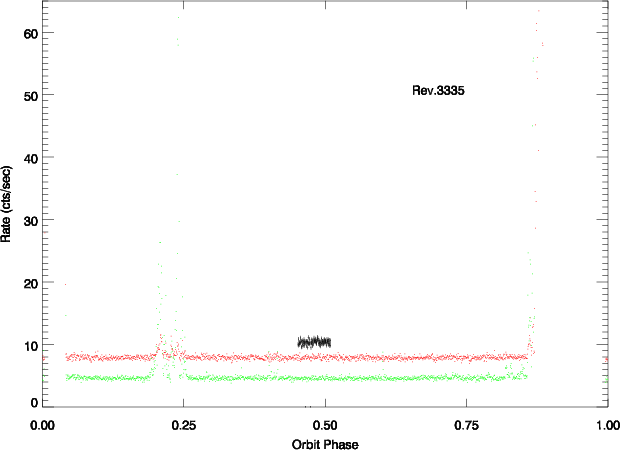
| 3335_0811012401_EPN_S016 | 10.0 | 2018-02-23T20:30:27.0 |
|
|
|
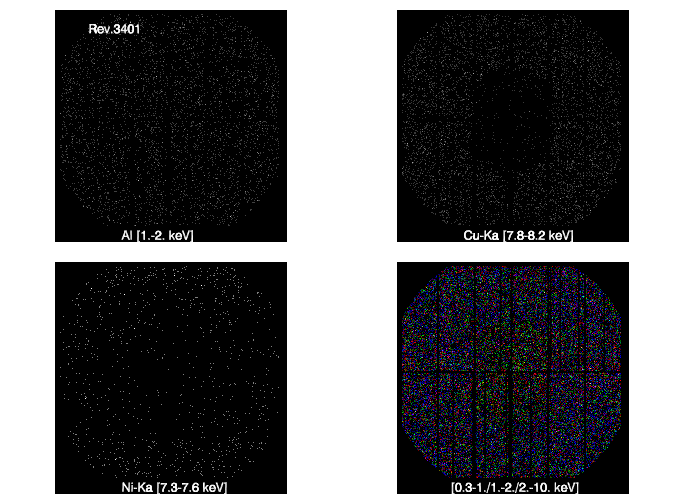
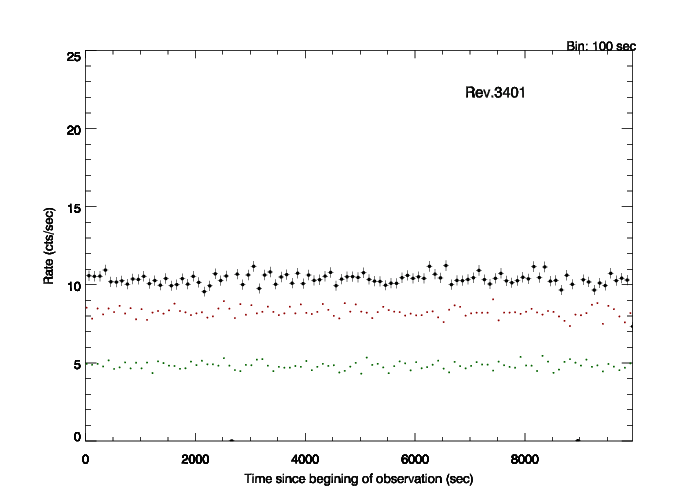
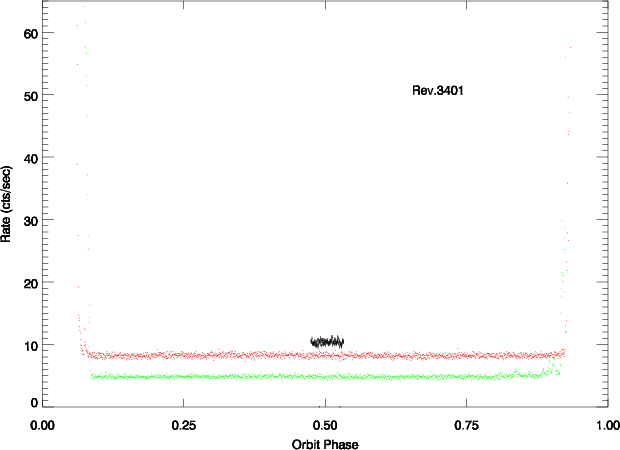
| 3401_0414191401_EPN_S027 | 10.0 | 2018-07-05T12:37:28.0 |
|
|
|
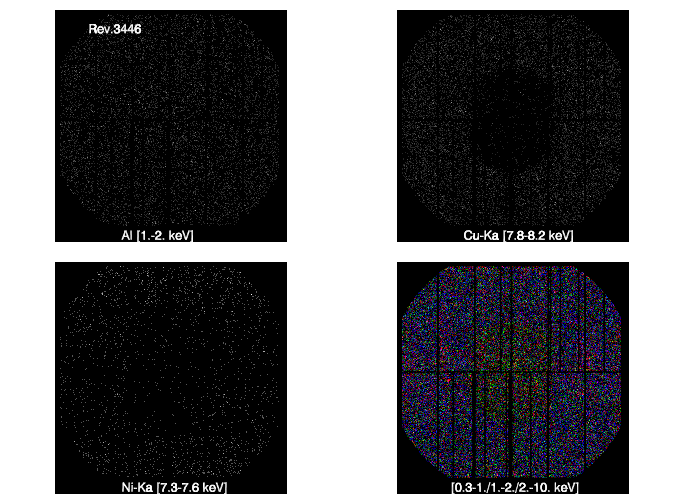
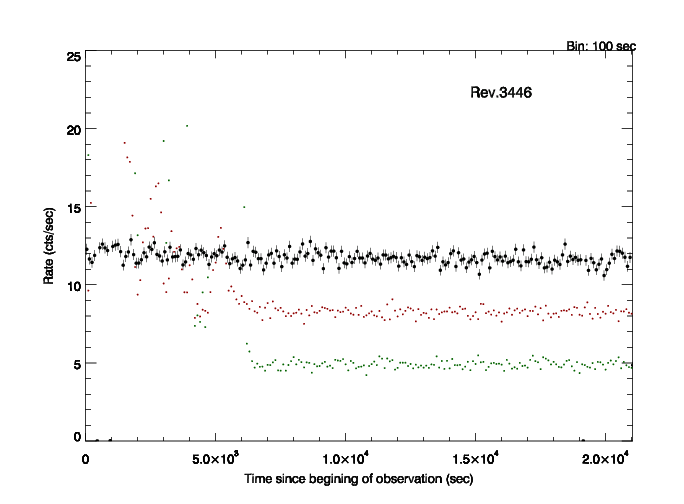
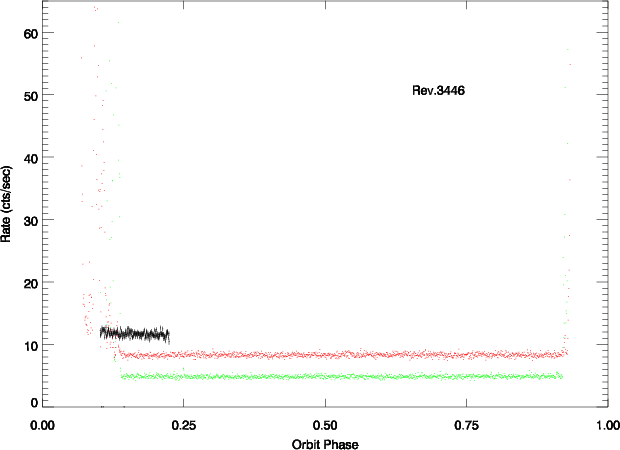
| 3446_0810850101_EPN_S002 | 21.0 | 2018-10-02T12:36:12.0 |
|
|
|
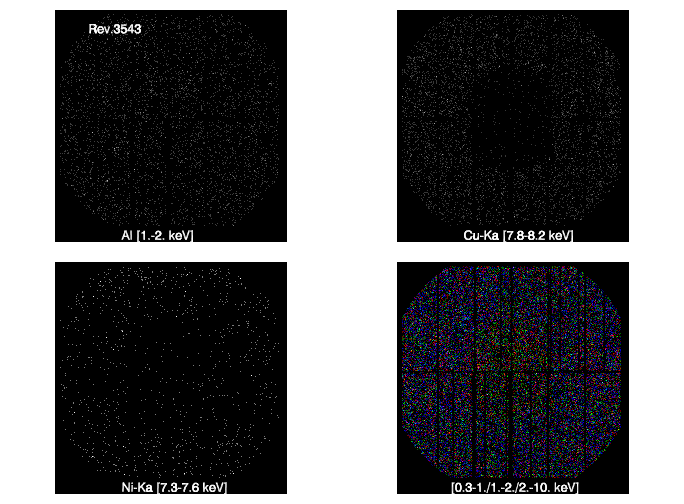
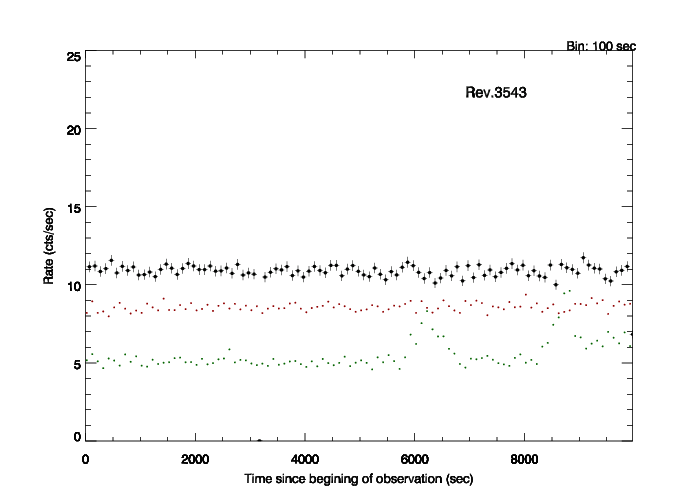
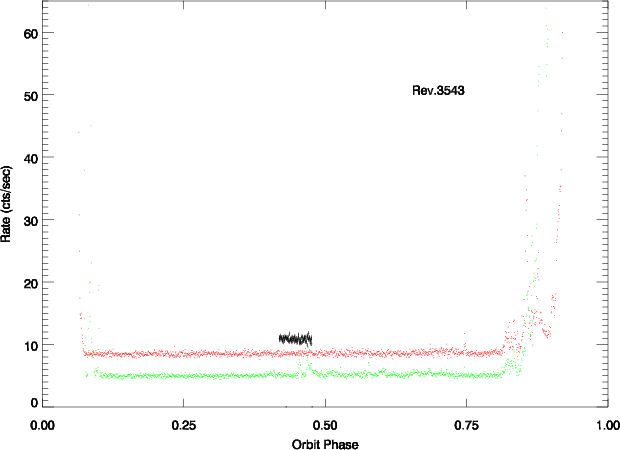
| 3543_0810870101_EPN_S012 | 10.0 | 2019-04-14T14:31:45.0 |
|
|
|
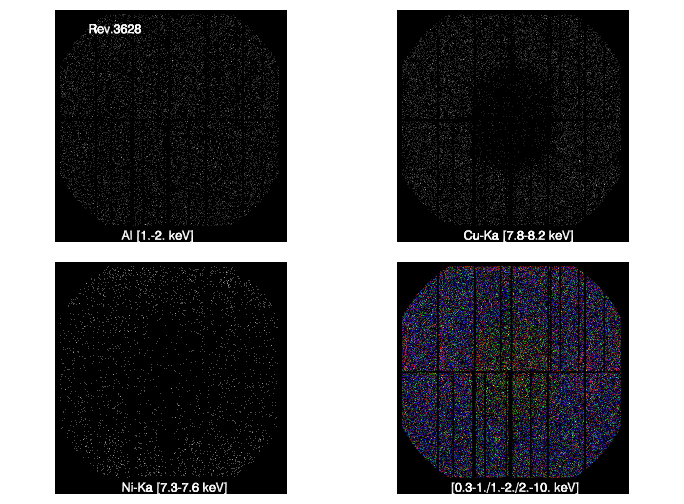
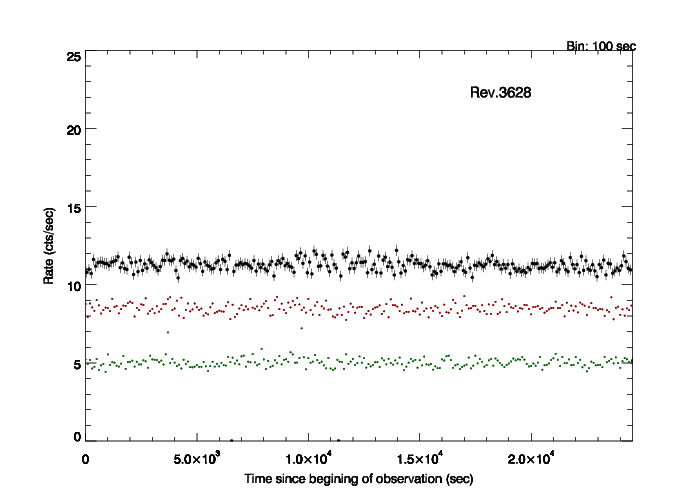
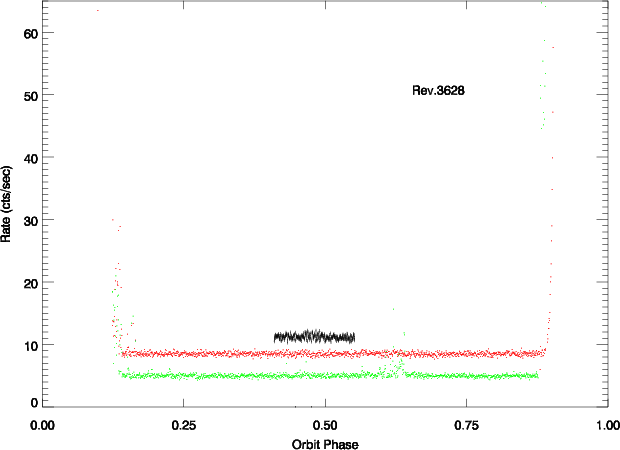
| 3628_0810850501_EPN_S002 | 24.5 | 2019-10-01T02:30:29.0 |
|
|
|
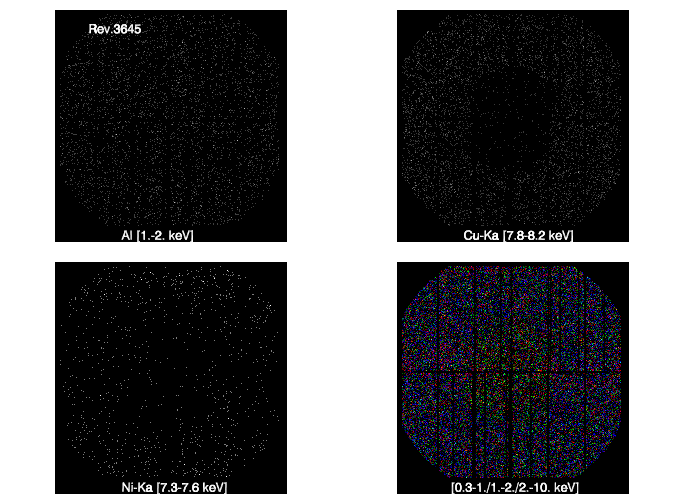
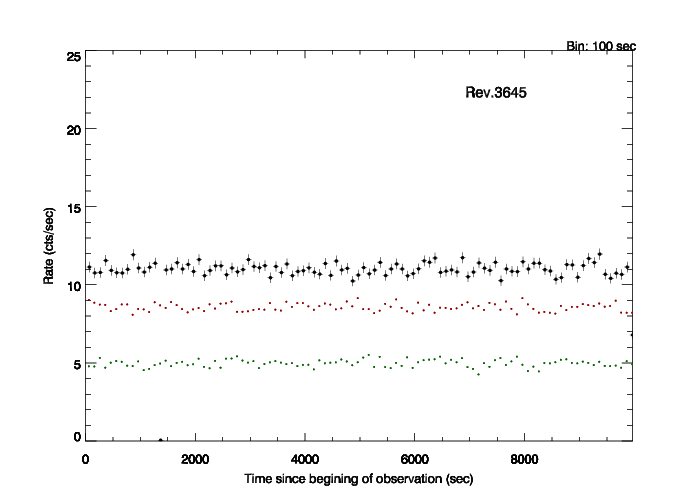
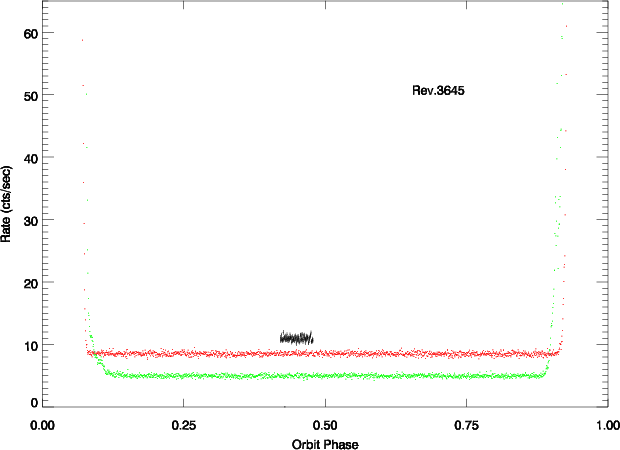
| 3645_0810880501_EPN_S012 | 10.0 | 2019-11-04T00:44:00.0 |
|
|
|
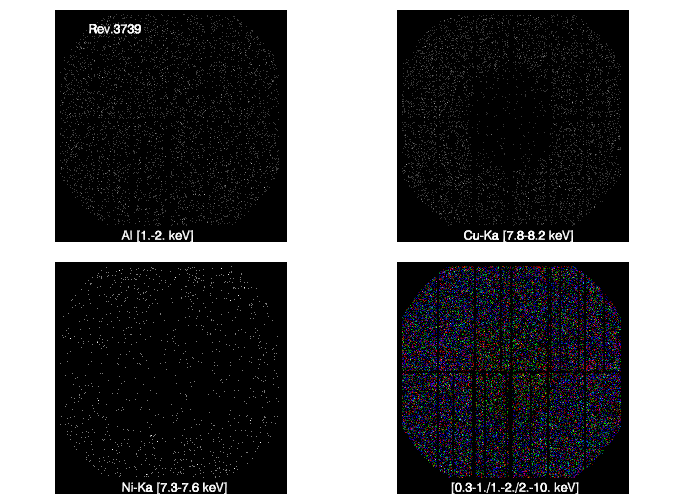
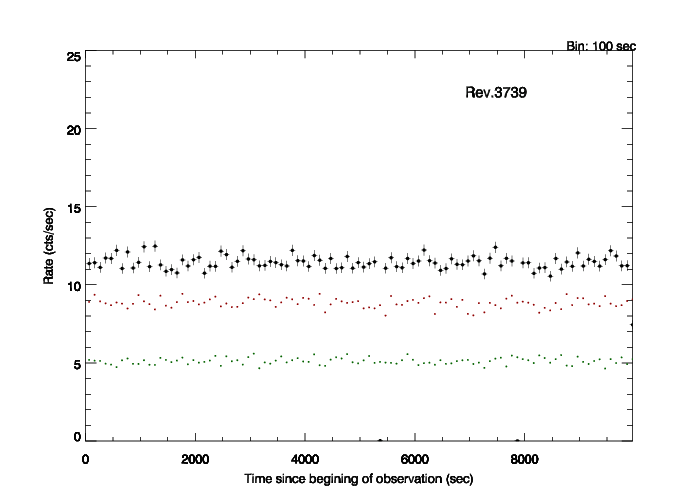
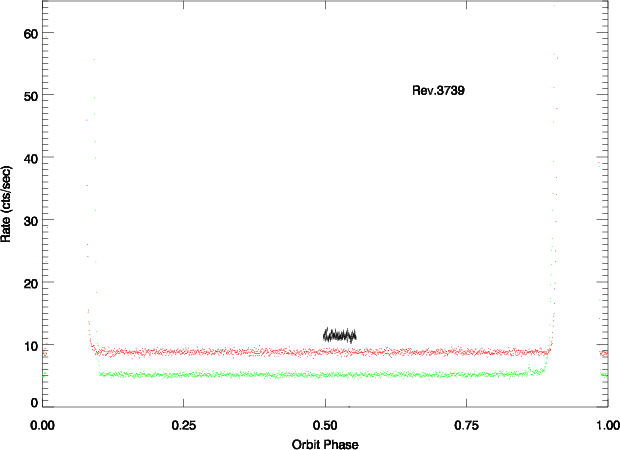
| 3739_0861450201_EPN_S010 | 10.0 | 2020-05-09T15:42:06.0 |
|
|
|
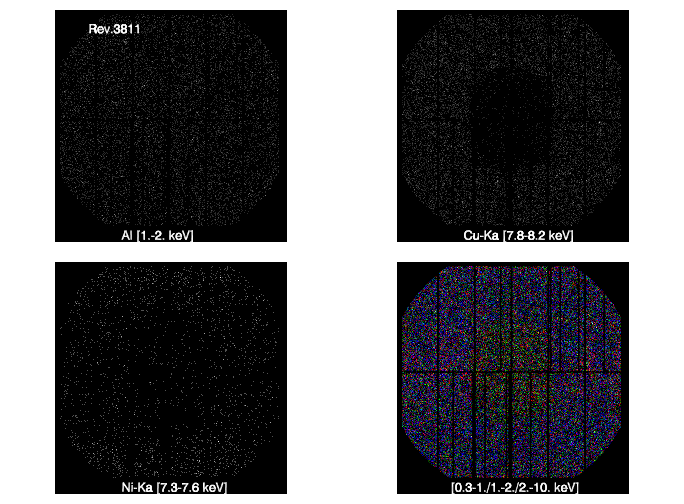
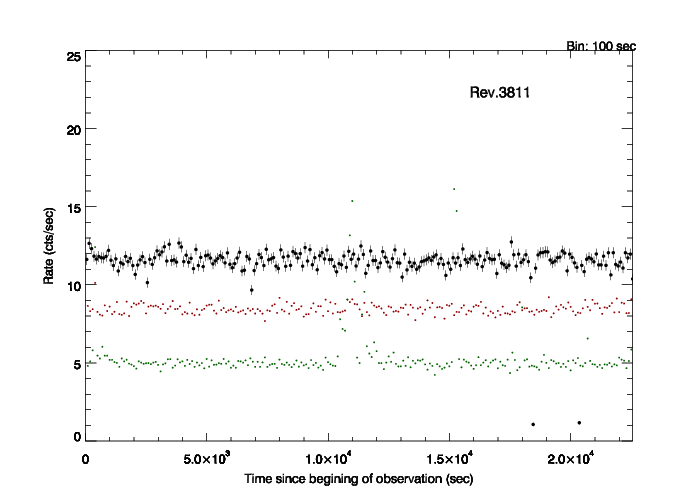
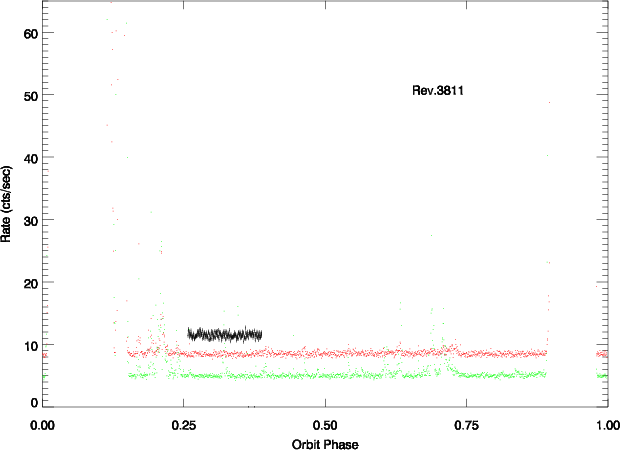
| 3811_0810850601_EPN_S002 | 22.6 | 2020-09-29T18:29:07.0 |
|
|
|
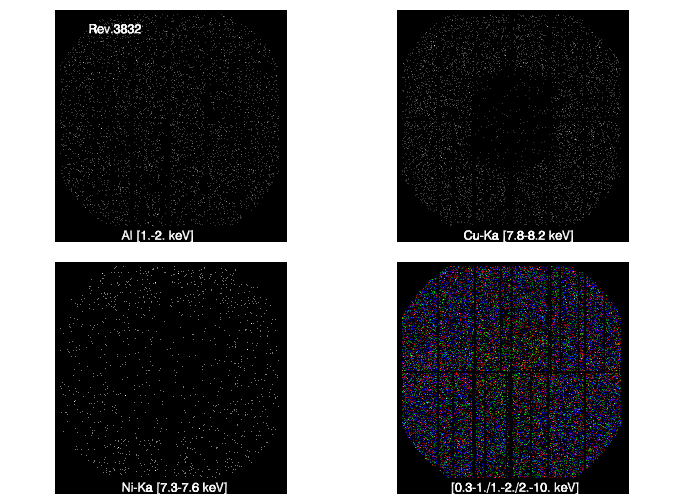
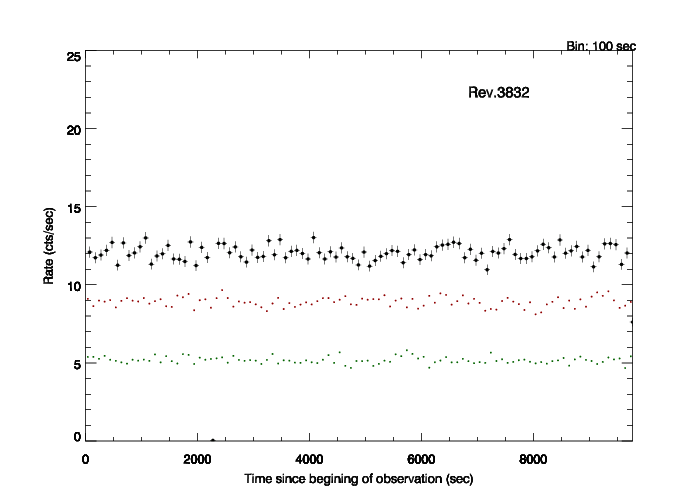
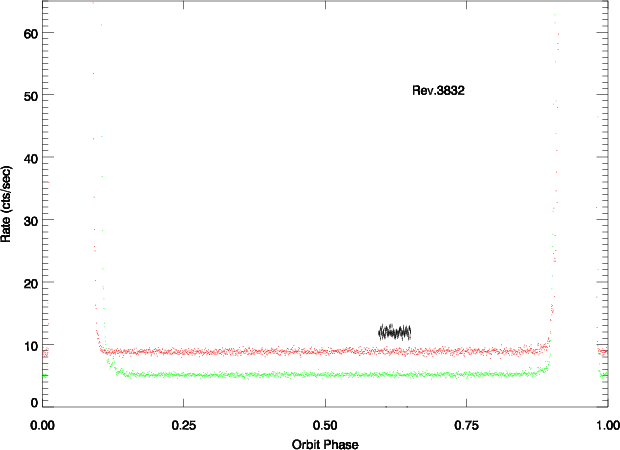
| 3832_0865450901_EPN_S006 | 9.8 | 2020-11-11T07:48:37.0 |
|
|
|
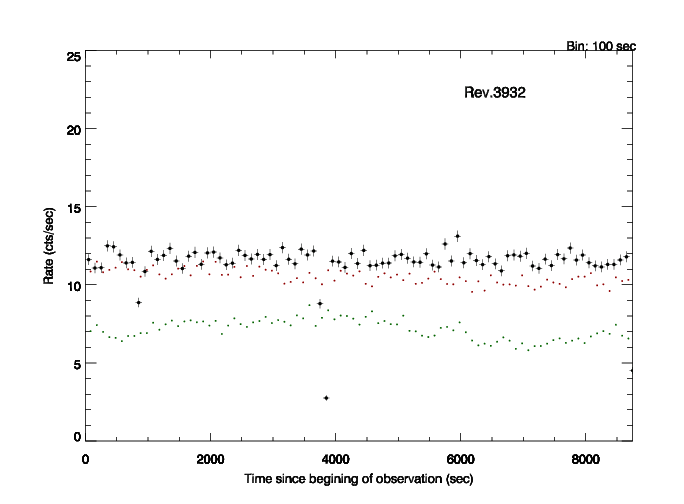
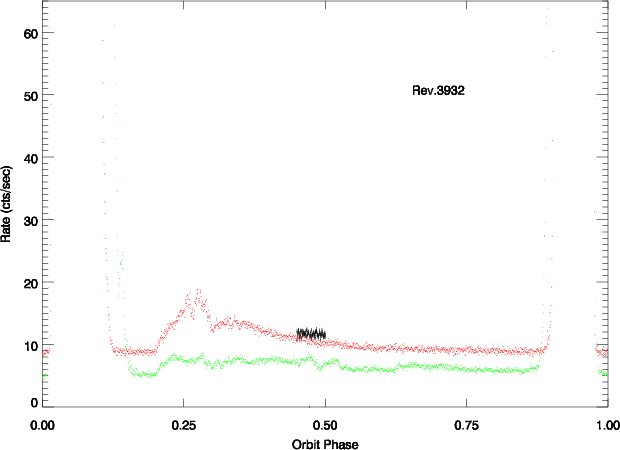
| 3932_0871590701_EPN_S604 | 8.8 | 2021-05-29T11:29:40.0 |

|
|
|
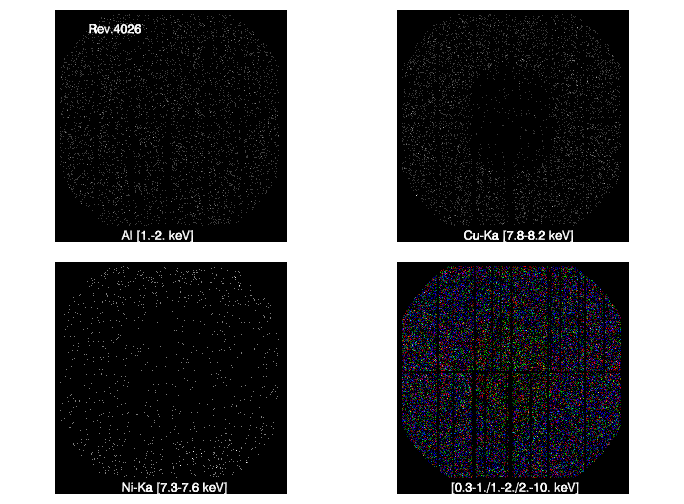
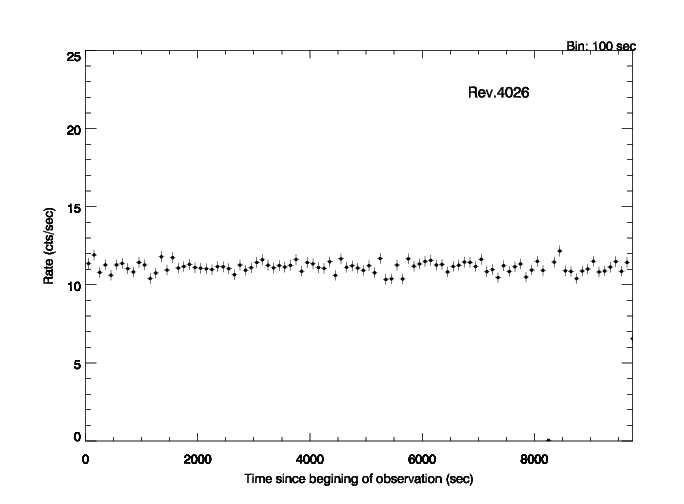
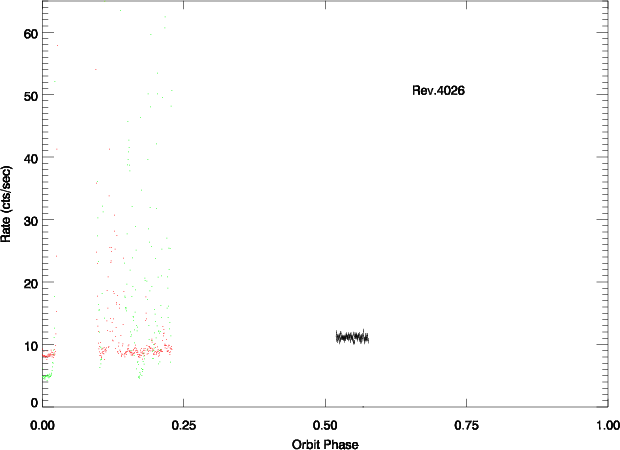
| 4026_0884970401_EPN_S003 | 9.8 | 2021-12-03T02:06:55.0 |
|
|
|
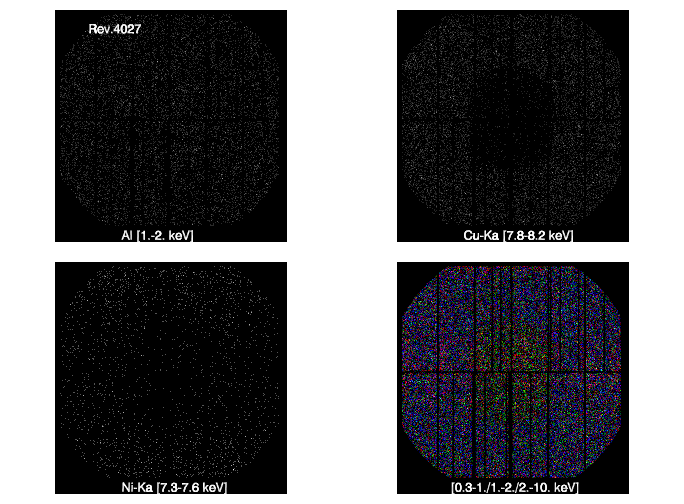
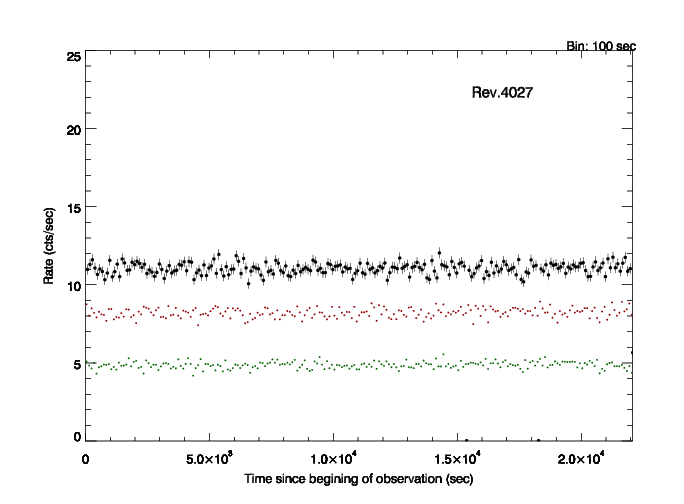
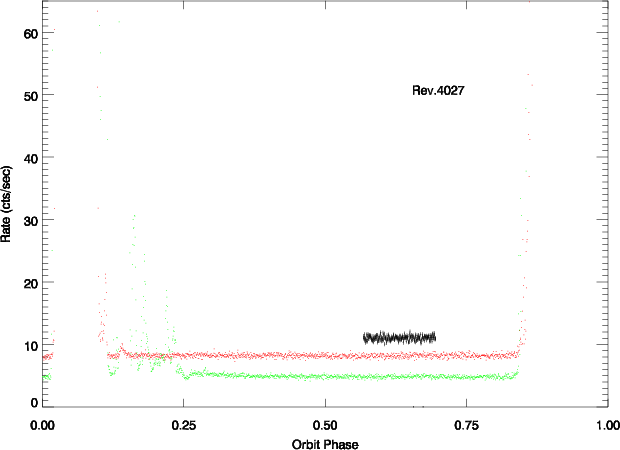
| 4027_0810850701_EPN_S002 | 22.1 | 2021-12-05T04:17:30.0 |
|
|
|