Next: 5.19 The RGS pipeline products Up: 5 Analysis of RGS spectrometer data Previous: 5.17 Use of rgslccorr
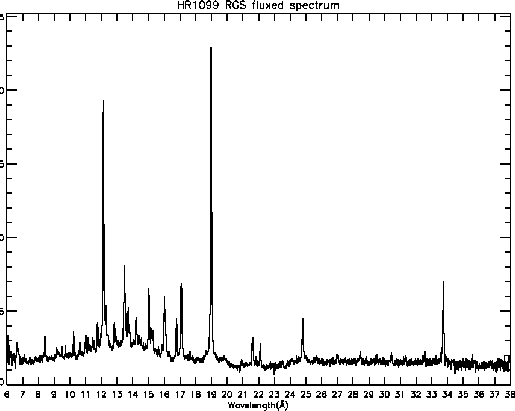
Although a rigorous analysis of RGS spectra for calculating physical model parameters requires the simultaneous use of individual spectra and their associated response matrices, it is often useful to produce a figure to show the overall properties of an X-ray spectrum observed with the RGS. The task rgsfluxer can be used to produce a single illustrative fluxed spectrum from any number of component spectra and response matrices from any combination of RGS1 and RGS2 and 1st and 2nd order. In contrast with rgscombine described in § 5.15, the spectra do not need to be aligned. If the spectra are not background corrected, which is the default for rgsproc, don't forget to tell rgsfluxer about the background spectra. For example, if several total and background spectra of HR1099 are collected in a directory, the following commands will produce the rough picture of the mean stellar spectrum shown in Fig. 49.
 setenv SPECTRA *SRSPEC*
 setenv BKGs    *BGSPEC*
 setenv RMFs    *RSPMAT*
 rgsfluxer pha="$SPECTRA" bkg="$BKGs" rmf="RMFs" file=HR1099.RGS.spectrum
|
The output of rgsfluxer is a tabulation of physical flux against wavelength and it can be useful for this to serve as an model-free input spectrum for comparison with lower-resolution spectra from the EPIC instruments, for example, in particular. The task rgsfluxmodel recasts the output of rgsfluxer into a file format suitable for use as an Xspec table model that can be read into Xspec using the atable command.