Next: 3.3.10 EPIC out-of-time events Up: 3.3 EUROPEAN PHOTON IMAGING CAMERA (EPIC) Previous: 3.3.8 EPIC's sensitivity limits
Photon pile-up, i.e., the arrival of more than one X-ray photon in one camera pixel or in adjacent pixels before it is read out, can affect both the PSF and the spectral response of EPIC.
Table 3 provides estimates of count rates and approximate incident fluxes for the different EPIC instrument modes for which pile-up should not be a problem. For the MOS full imaging mode, e.g., ca. 0.5 counts/s should not be exceeded. Note that the provided incident fluxes depend on the source spectrum and pile-up can become an important effect at even lower incident fluxes for sources with very steep (i.e. soft) spectra. This is because the expected count rates for a given incident flux are higher for soft than for hard spectra. On the other hand at larger off-axis position pile-up is less likely.
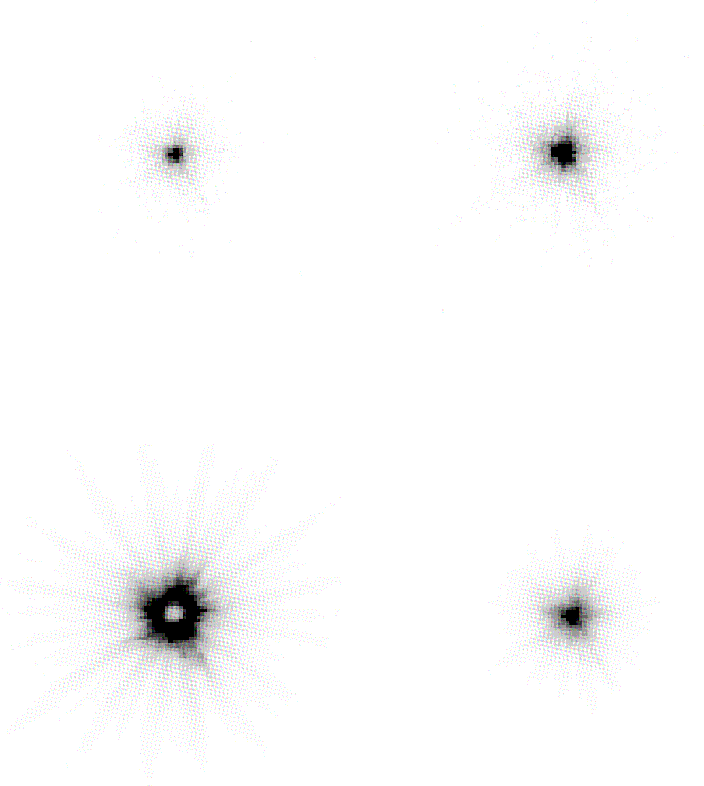
The PSF is influenced by pile-up, because in the core of the PSF many photons arrive at almost the same time (within one readout frame), creating multi-pixel photon patterns which, for the MOS camera, are then rejected by the onboard event reconstruction software (which suppresses large size events, such as that induced by most of the cosmic rays). For the pn camera, event reconstruction is performed offline in the SAS. The pile-up effect leads, in the most extreme case, to a PSF with an artificial “hole” at its centre, as displayed in Fig. 38.
 |
The spectral response is compromised, because the charge deposited by more than one photon is added up before being read out, thus creating artificial “hard” photons where there have actually been two or more soft photons.
Pile-up effects on the spectral shape are very much reduced by selection of mono-pixel events. The effect of pile-up in this case is then essentially a loss of flux. Also, in case of very strong pile-up, building spectra and calculating absolute fluxes is still possible with a good accuracy by excising the heavily piled-up core (see below) from the analysis.
To get an idea on how important the pile-up effect can be for spectral
analyses, a k = 1 keV Raymond-Smith model spectrum with
 cm
cm was simulated using a ray-tracing code
and the fit to the resulting “observed” spectrum was compared with the input for EPIC
MOS observations in the full window mode (Table 5).
was simulated using a ray-tracing code
and the fit to the resulting “observed” spectrum was compared with the input for EPIC
MOS observations in the full window mode (Table 5).
Input flux |
Output count
rate
[s ] ] |
Counts per MOS frame | N [10
[10 cm cm ] ] |
kT [keV] | Norm./ expect |
| 4.05 | 1.08 | 0.22 | 3.0 | 0.967 | 1 |
| 13.4 | 3.56 | 0.71 | 3.05 | 0.972 | 1 |
| 40.5 | 10.5 | 2.1 | 3.2 | 0.979 | 0.98 |
| 134 | 33.3 | 6.65 | 3.5 | 1.010 | 0.95 |
| 405 | 85.4 | 17.1 | 4.1 | 1.022 | 0.80 |
 erg s
erg s cm].
cm].
 |
One can see how the best-fitting
 , k and normalisation vary as a function of input source flux (and
thus count rate per frame). Note that, because of the photon pile-up, one
apparently loses soft photons (whose charge combines and is then seen at
higher energies), thus requiring a higher and also a higher k
to reach the minimum
, k and normalisation vary as a function of input source flux (and
thus count rate per frame). Note that, because of the photon pile-up, one
apparently loses soft photons (whose charge combines and is then seen at
higher energies), thus requiring a higher and also a higher k
to reach the minimum  for the fit.
The peculiarity that for low fluxes the fitted k is a bit lower than the
input value is explained by the fact that the simulation was
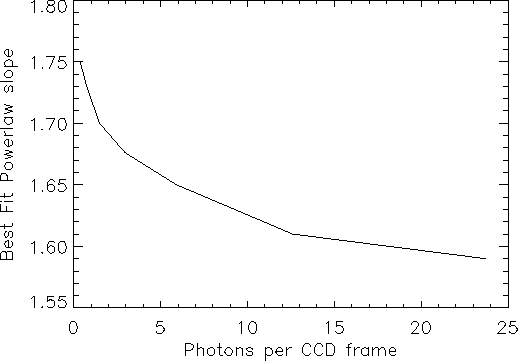
performed without event reconstruction. What is important to note is the
relative change in k. A similar change is also caused in the best-fitting
slope of a power law, as displayed in Fig. 39. The
effect of pile-up on the PSF has been taken into account in these
simulations by choosing an appropriately large photon extraction region
for the spectral analysis.
for the fit.
The peculiarity that for low fluxes the fitted k is a bit lower than the
input value is explained by the fact that the simulation was
performed without event reconstruction. What is important to note is the
relative change in k. A similar change is also caused in the best-fitting
slope of a power law, as displayed in Fig. 39. The
effect of pile-up on the PSF has been taken into account in these
simulations by choosing an appropriately large photon extraction region
for the spectral analysis.
Note: No error bars are provided in Table 5,
because the input spectrum is a numerical model spectrum without
noise.
For up to 2 counts per MOS frame, the typical error on N stays below
10%, those on k and the normalisation stay at a level of 2%.
stays below
10%, those on k and the normalisation stay at a level of 2%.
The SAS task epatplot can be used as a diagnostic tool for pile-up in
the EPIC cameras. It utilises the relative ratios of single- and double-pixel
events which deviate from standard values in case of pile-up.
Fig. 40 shows the produced plot for a source
with a count rate of  counts/s in pn full frame mode.
As input an eventfile was used which contains all events extracted from a
circle with radius 1 arcmin around the source position. In the upper panel,
the spectral distributions as function of PI channel for single-, double-,
triple- and quadruple-events (these are the four types of valid events which
can be created by an X-ray photon) are plotted. Invalid patterns are
also shown to indicate how much energy is lost by pattern pile-up
(refer to the pile up thread at
How to evaluate pile-up for additional details).
counts/s in pn full frame mode.
As input an eventfile was used which contains all events extracted from a
circle with radius 1 arcmin around the source position. In the upper panel,
the spectral distributions as function of PI channel for single-, double-,
triple- and quadruple-events (these are the four types of valid events which
can be created by an X-ray photon) are plotted. Invalid patterns are
also shown to indicate how much energy is lost by pattern pile-up
(refer to the pile up thread at
How to evaluate pile-up for additional details).
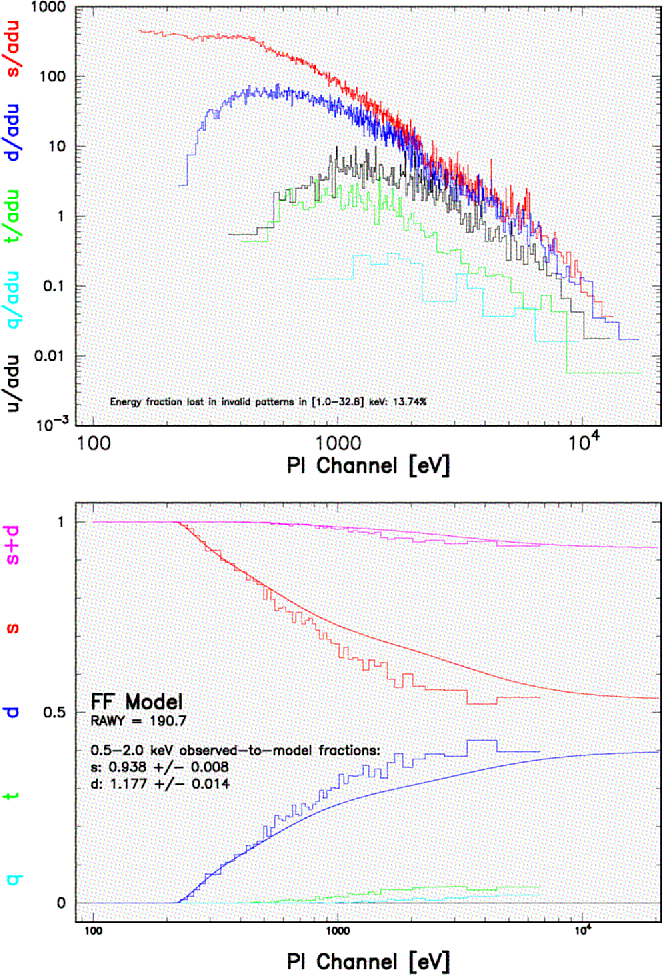 |
Doubles can only be produced when the energy of both events is above the event threshold. Similarly triples and quadruples start at 3 and 4 times the threshold, respectively. In the lower panel the fraction of the four valid event types are plotted (relative to the sum). The ratios are energy dependent with higher energy photons producing less singles due to the increasing size of the electron cloud. As long as the count rate is below the pile-up limit the energy dependence follows standard curves. These are plotted for singles (1.0 at energies below twice the threshold and then decreasing with energy), doubles and singles+doubles. The curves are also used in the detector response matrices to correct for the pattern selection used in the spectrum to be analysed. In the case of pile-up, the ratios deviate from the standard curves as the example shows. Due to `pattern pile-up' more doubles (which are actually two neighbouring singles) are produced.
A quantitative comparison of both types of EPIC camera with the Chandra ACIS-I instrument in this respect is provided in § 3.7.1.3.
Estimates of the pile-up fraction as a function of pattern, and of
the associated flux loss for single events are presented by
Ballet (1999, A&ASS, 135, 371); the treatment is extended to double pixels in
Ballet (2003, AdSpR, 32, 2077).
Empirical methods to estimate and partly to
correct pile-up based on single-event spectra in EPIC-MOS are discussed in
Molendi & Sembay,
(2003; http://xmmweb.esac.esa.int/docs/documents/CAL-TN-0036-1-0.ps.gz).
European Space Agency - XMM-Newton Science Operations Centre

